Visual Grounding in 2026: Where Multimodal Models Still Fail on Real Documents
Multimodal models still fail at visual grounding on real documents. See where they break, why benchmarks miss it, and a protocol to test before you ship.
The Grounding Gap Is Now the Bottleneck
Multimodal benchmark scores keep climbing, and yet document-heavy workflows keep hitting the same wall. A model that scores near the top of a chart-understanding leaderboard will still attach a merged-cell value to the wrong line item, interpolate a value off a log-scale axis as if it were linear, or quietly skip a handwritten margin note. The headline numbers say the problem is solved. Production says otherwise.
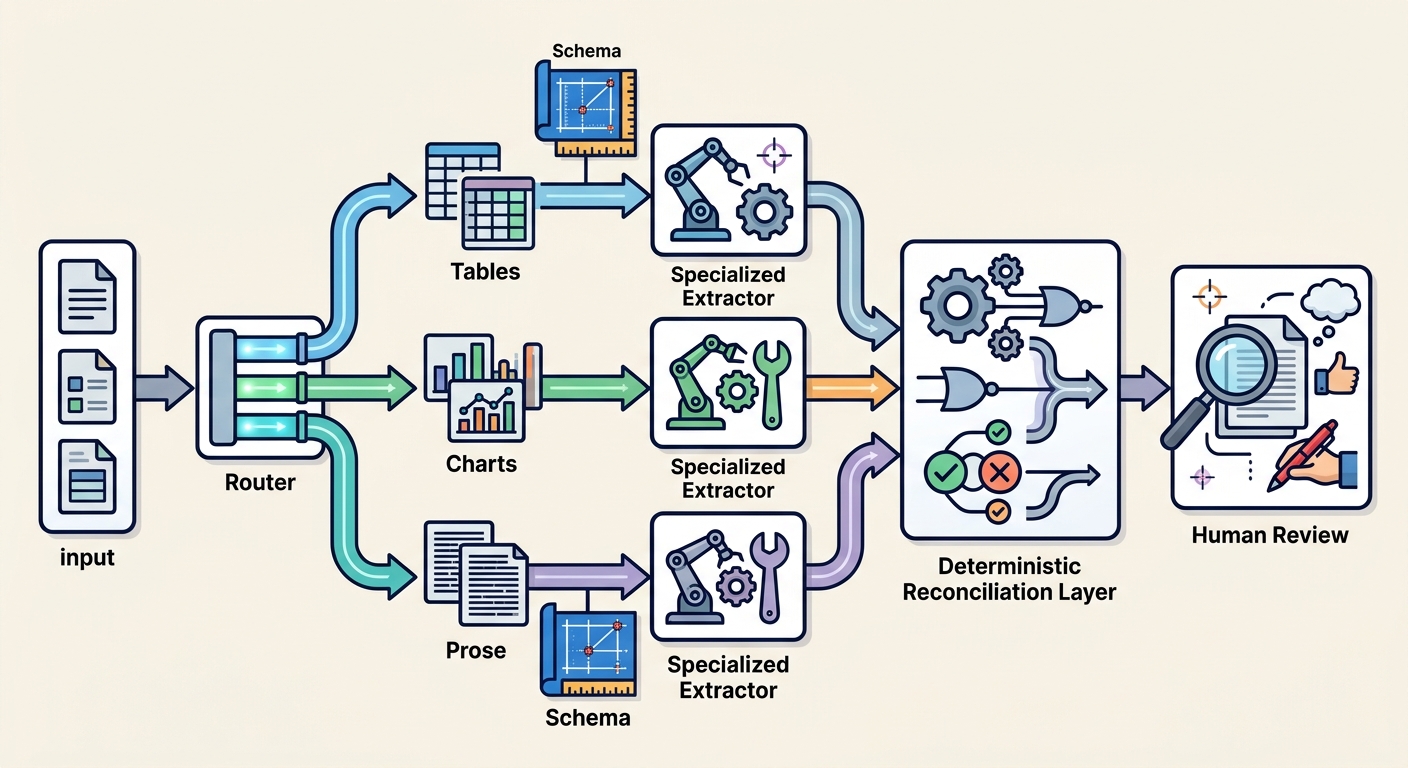
The important shift is that these failures are no longer random. They are concentrated in specific document features, predictable, and testable — which means they can be engineered around rather than argued about. What follows is a failure taxonomy drawn from real document workloads, an explanation of why public benchmarks underweight these cases, and a practical evaluation protocol you can run before you sign a contract or ship a pipeline.
If you are evaluating models for invoices, contracts, financial statements, claims, or lab reports, the question is not "can the model read this document?" It is "where does grounding break, and does it tell us when it breaks?"
What Visual Grounding Actually Means in 2026
Visual grounding is the task of mapping a language reference to a specific region in the image — a bounding box, a table cell, an axis position, a signature block. When a user asks "what is the total on line 4?" or "which series peaks in Q3?" the model must localize before it can answer. Grounding is the localization step, not the answer.
This is distinct from two things it is routinely confused with:
- OCR-adjacent text extraction — pulling characters and words out of an image. A model can extract every token on a page and still fail to bind those tokens to the right structural role.
- Holistic document understanding — producing a plausible summary, classification, or set of extracted fields. This is the output most vendors demo, and it is the output most benchmarks score.
The 2024–2026 trajectory made this distinction sharper, not blurrier. Models got dramatically better at describing documents — summarizing a page, answering questions about its gist, explaining what a chart is "about." They improved far more slowly at localizing content within the page at the precision that downstream systems require. Description tolerates approximation. Localization does not.
There is a second subtlety worth stating plainly, because it changes how you test: grounding and answering are entangled, and a correct answer is not evidence of correct grounding. A model can land on the right number by reading the wrong cell (lucky), or localize the right region and still misread its contents. For evaluation, score the region and the answer independently. A pipeline that only checks the final answer will pass models that are quietly guessing.
A model can summarize a chart correctly and still misread the data point. Buyers who test only the summary will never see the second failure.
For procurement and evaluation leads, this is the crux. The capability that gets marketed is document understanding. The capability that determines whether your pipeline works is coordinate-level grounding. Whether the two are tightly correlated is an empirical question — and one you should answer with your own document set rather than assume from a demo. (See also: how to evaluate multimodal models for document AI.)
Where Multimodal Models Still Fail on Real Documents
The failures below are the ones that recur across production document sets. None of them are exotic. All of them are common enough that a serious evaluation should include them by default.
Dense Tables and Merged Cells
Cell-level grounding is where structured documents punish models most. Merged cells, multi-row and multi-column headers, and nested tables break the assumption that a document is a clean grid. The model has to infer that a header spanning three columns applies to all three, or that a value in a merged block belongs to a group rather than a single row.
When this inference fails, the model conflates row and column associations and attaches values to the wrong entity. A subtotal gets attributed to the line above it. A currency indicator in a merged header silently applies to the wrong column. The dangerous part is that the output is fluent and confident — the extracted table reads as correct until someone reconciles it against the source. (Related: table extraction accuracy benchmarks.)
Charts, Axes, and Implicit Legends
Chart grounding fails in ways that are easy to miss and expensive downstream. Two patterns dominate:
- Axis property and interpolation errors. The model misreads the axis transform — treating a log scale as linear, a broken axis as continuous, or a non-zero baseline as starting at zero. It then interpolates linearly between labeled ticks regardless of the underlying scale, producing a value that looks reasonable and can be off by an order of magnitude. Broken axes are especially treacherous: the model treats the gap as continuous and reports a value that does not exist on the chart.
- Legend-to-series mapping. When a chart has multiple series in similar colors or a legend that relies on position rather than explicit labels, the model mismaps series to values.
Models also tend to present approximate readings as exact numbers. A value eyeballed off a bar chart can surface as "47.3" in the output with no confidence qualifier or rounding. That false precision then flows into calculations, and the error compounds silently. Multi-series charts with near-identical colors remain a reliable stress test — if a model passes that, it is doing real work.
Spatial References and Reading Order
Multi-column layouts, sidebars, pull quotes, and footnotes all test whether a model can reconstruct the intended reading order. Many cannot do so reliably. Text gets sequenced across columns mid-sentence, and captions get bound to the wrong figure — a failure that is invisible in a summary but fatal in a technical document.
Relational queries are the sharpest probe here. Ask for "the value in the box to the right of the deductible field" and grounding accuracy degrades sharply. The model has the text; it lacks a reliable spatial model of where things sit relative to each other. Test both absolute localization ("the total in the top-right cell") and relational localization ("the cell to the right of X") — they fail differently.
Stamps, Signatures, and Handwriting
Overlapping stamps — approval marks, received-date stamps, notary seals — physically obscure the text beneath them. Grounding confidence drops, but the model rarely flags the occlusion. It produces a best guess with the same tone as a clean read.
Handwritten annotations are a separate failure mode: margin notes, corrections, and initials are frequently skipped entirely rather than misread. A skipped note is worse than a wrong one in most workflows, because a wrong extraction can trigger review while a missing one passes silently. This is where the confidence problem becomes concrete: a model that reports every field at uniform confidence gives your review queue nothing to triage on.
Why Public Benchmarks Underweight These Cases
Public document benchmarks reward the capability that is easiest to score at scale: end-to-end field extraction or question answering against a clean, curated document set. That design has three structural blind spots:
- Answer-scored, not region-scored. Most benchmarks check the final answer, not whether the model localized the correct region. A lucky guess and a grounded read are indistinguishable in the score.
- Clean documents. Curated test sets tend to exclude the messy features — overlapping stamps, merged headers, broken axes, handwriting — that drive production failures.
- No abstention credit. A model that guesses on an occluded field and a model that flags it for review can score identically if the guess happens to be right. Calibration is invisible.
None of this is a knock on the benchmarks; they measure what they measure. The point is that a high score tells you the model is good at the task the benchmark defines, and that task is not your pipeline.
A Practical Evaluation Protocol
Run this before you sign. It is deliberately small — a few hundred documents is enough to surface the failure modes above.
- Build a stratified test set from your own documents. Include at minimum: dense tables with merged cells, at least one log-scale and one broken-axis chart, multi-column layouts with footnotes, documents with overlapping stamps, and pages with handwritten annotations. Do not let vendors supply the test set.
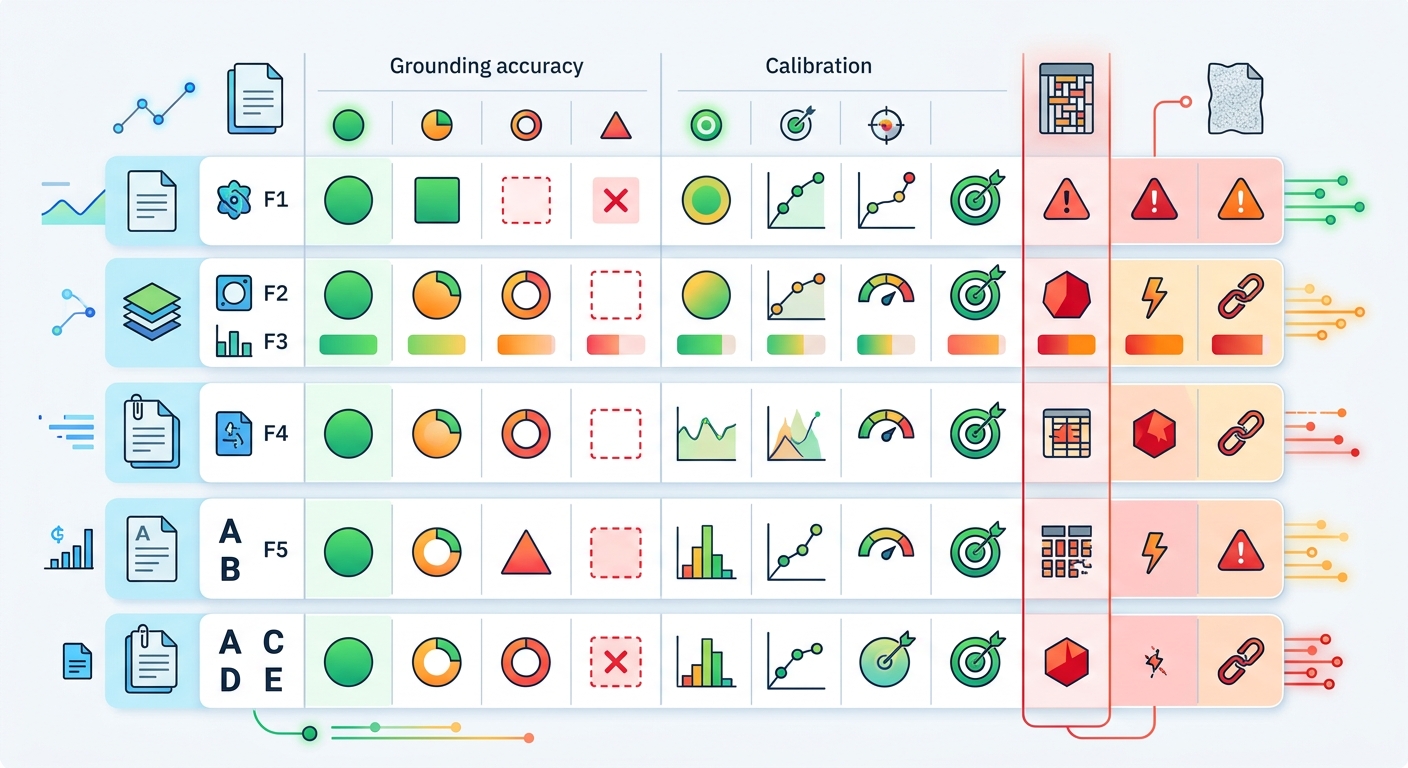
- Score region and answer separately. For each item, record whether the model localized the correct region and whether the answer is correct. Report them as two numbers. A model with high answer accuracy and low region accuracy is guessing.
- Test relational queries explicitly. Include "the cell to the right of X" and "the series that peaks in Q3" style prompts alongside absolute ones.
- Measure calibration, not just accuracy. For occluded or ambiguous fields, check whether the model's stated confidence (or abstention) tracks correctness. Plot a risk–coverage curve: at a given coverage level, what is the accuracy of the answers the model chooses to give? A model that abstains on the hard cases and is accurate on the rest is far more useful than one that answers everything at uniform confidence.
- Reconcile tables against source. Spot-check extracted tables line by line, not just in aggregate. Merged-cell errors are invisible in summary metrics.
- Set pass/fail thresholds before you run it. Decide in advance what region-level accuracy and what calibration you need for your workflow — then hold the vendor to those numbers, not to a leaderboard rank.
The models are genuinely better than they were two years ago, and for many description tasks they are good enough today. For coordinate-level grounding on real documents, the gap is still there — but it is now a gap you can measure, price, and design around. That is the whole point of testing it yourself.