LLM Observability in 2026: The Metrics That Actually Keep Production Agents Cost-Effective and Reliable
Production AI agents need observability that tracks token cost per session, failure cascades, and eval loops. Here are the metrics that keep them reliable and profitable.
Why Traditional Monitoring Fails for Agents
We deployed our first agent two years ago. It worked beautifully in staging. In production it started answering confidently wrong, quietly eating tokens, and no alert ever fired. That was the moment we understood the problem: the monitoring stack we built for REST APIs was measuring the wrong things.
An AI agent is not a normal application. It breaks a problem into reasoning chains. It calls tools. It retrieves context. The same prompt can produce different outputs from one run to the next. That non-deterministic behavior makes classic application performance monitoring nearly useless.
Traditional monitoring watches request counts and error codes. Agents fail differently. They fail silently — producing fluent, confident, but ungrounded answers that sail past standard alerting. They consume hidden cost in reasoning loops no one tracks. And they cascade, with one bad step poisoning every step after it.
If you want agents that pay for themselves, you need a different set of metrics. This guide covers the observability signals that actually control cost and reliability in 2026.
The Cost Side — Beyond Price-Per-Token
Per-token prices fall about ten-fold every year. Competitive GPT-4-level models now cost under a dollar per million tokens (estimated). Yet most teams I talk to report rising agent bills anyway. That is the cost paradox.
Here is why. A reasoning model can consume 50 to 100 times more internal tokens than its output length suggests (estimated). An agent that returns a 200-token answer may have burned 20,000 tokens thinking, re-reading context, and re-calling tools. Cheap tokens do not equal cheap agents.
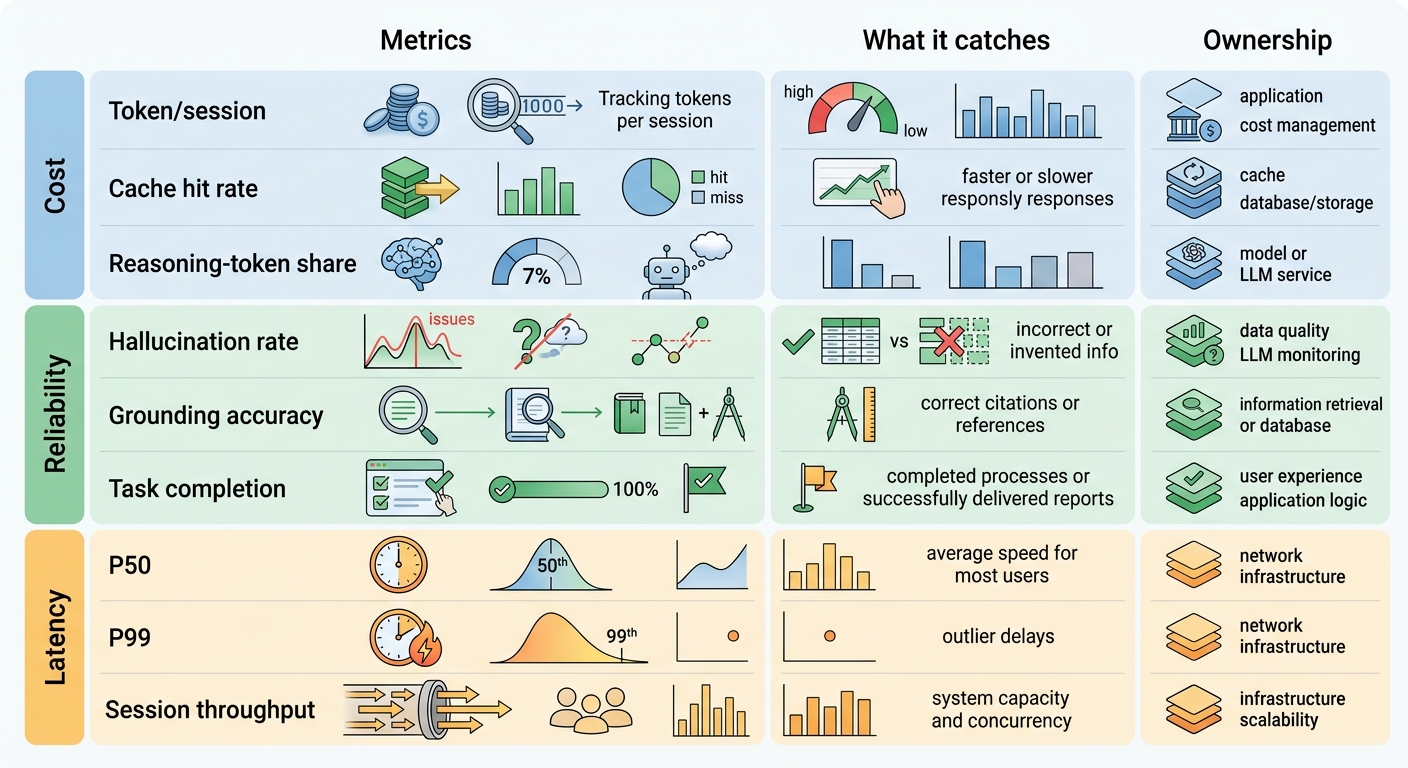
Track Token Consumption Per Session
The metric that matters most is token consumption per session. Not per request. A session is the full interactive workflow — every reasoning step, tool call, and context handoff. When you measure at session level, runaway reasoning loops become obvious.
Set a per-session token budget. For our support agent we capped 15,000 tokens per completed case. Anything above that flagged a possible reasoning loop or prompt bloat. Budget caps turn vague cost fear into a concrete, alertable number.
Cache Hit Rates and Context Reuse
Many requests repeat the same context. System prompts, tool definitions, retrieved documents — costly to send every time. Monitor your prompt-cache hit rate. A jump from 40% to 70% on a high-volume agent cut our spend by a third with no quality change.
Tool-Call Churn
Agents that re-invoke the same tool repeatedly waste tokens. Track tool-call churn — repeated calls to the same tool within a session. It exposes poorly written instructions or missing state persistence.
Key cost insight — per-token prices fall ~10x a year, but agent bills rise because reasoning models burn 50–100x more internal tokens. Measure cost per session, not cost per token.
When Self-Hosting Actually Saves Money
Self-hosting only pays off when GPU utilization stays above roughly 50% sustainably. As a rule of thumb, that means workloads generating 50 to 100 million tokens per month (estimated). Below that, managed API services win on economics. Track utilization before you commit to GPUs.
The Reliability Side — Metrics That Catch Real Failures
Reliability is where most agent projects die. Industry surveys in 2025 and 2026 report that 70 to 88 percent of agent projects fail to reach sustained production — mostly from reliability gaps, data quality, and integration complexity (estimated).
The Cascading-Failure Math
Failure compounds across steps. An agent with an 85 percent success rate at each of eight steps completes the full workflow correctly only about 27 percent of the time. Eight steps, each 85% reliable, and you fail 73 percent of the time.
That is why per-step metrics matter more than overall success. Track completion rate per step. Find the weakest step and fix it first. Improving one 85% step to 97% transforms the whole pipeline.
Hallucination Frequency
Hallucination frequency measures how often outputs contain claims unsupported by the retrieved context. Manual review cannot scale here. Most teams automate it with an LLM-as-a-judge — a second model that scores the primary output.
For RAG agents, add a grounding accuracy metric. It checks whether the answer is actually supported by the documents the agent retrieved. This separates retrieval failures from generation failures, so you know whether to fix the index or the prompt.
Task Completion and Tool Selection
For agents, the best overall quality signal is task completion rate — did the agent actually finish the user's goal? Layer on tool-selection correctness to confirm it used the right tool for the job. These correlate far better with business value than raw token counts.
Prompt and Use-Case Drift
Agents quietly change behavior over time. A model upgrade, a prompt tweak, or a data shift can degrade quality without any error spike. Track drift by scoring a small sample of live traffic against a baseline eval set each release. We caught a quality drop from a silent SDK update that way.
Latency and Throughput in Agentic Workflows
Per-request latency metrics lie for agents. A single user request can trigger ten sequential tool calls and model turns. The user-perceived latency is the sum of every hop, not the fastest one.
Watch P99, Not Just the Average
Track P50, P90, and P99 latency at session level. In multi-step workflows the tail dominates. A single slow tool call turns a fast agent into a sluggish one. The P99 is where your users feel it.
Session-Level Throughput
Measure throughput in completed sessions per second, not requests per second. Agentic sessions are far more resource-intensive than single-turn completions. Session-level throughput gives you honest capacity planning and shows where orchestration becomes the bottleneck.
Evaluation Loops — Turn Failures Into Tests
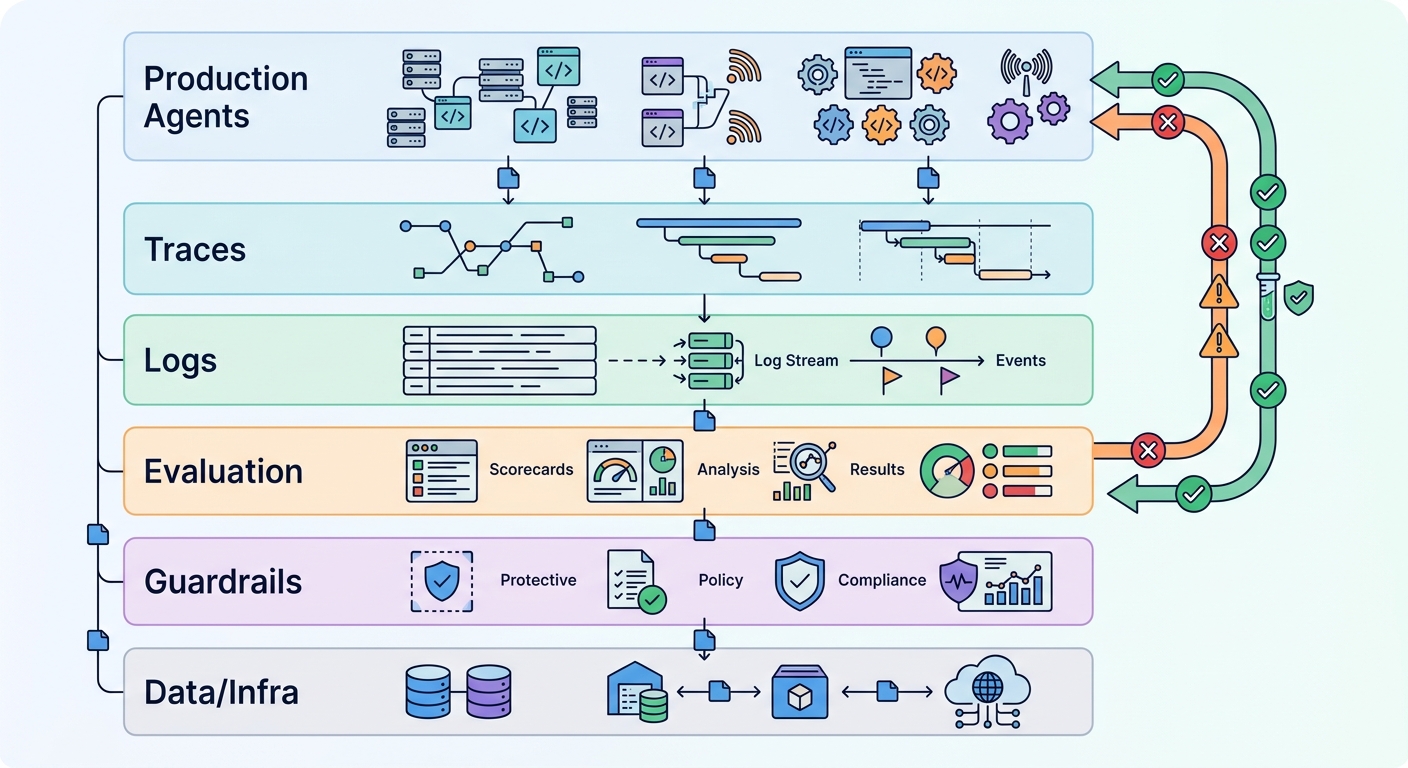
The single biggest reliability upgrade is the evaluation loop. The idea is simple: an observability platform captures traces, and the team converts every production failure into a permanent test case.
Start with a trajectory test. It assesses the agent's decision-making chain — the tool calls and reasoning steps — not just the final answer. A final answer can look right for the wrong reasons. Trajectory tests catch the wrong reasoning before it becomes a pattern.
The feedback cycle looks like this: production incident → trace captured → added to the regression eval set → run on every change → failure recurrence blocked. Over months, your eval set grows into a living record of everything that ever broke. Each new failure makes the whole system stronger.
Guardrails and Approval Gates
For risky actions, add guardrails — policy kernels that block or flag actions exceeding agreed boundaries. Add approval gates for high-impact autonomous actions like external sends or purchases. Human-in-the-loop checkpoints cut costly, risky autonomous behavior while preserving value. They also generate labels you can use to improve the agent.
Building Your 2026 Observability Stack
You do not need to buy everything at once. A reference stack has four layers, and each maps to the metrics above.
Traces capture the full decision chain — reasoning, tool calls, context retrieval. Logs keep raw detail for post-hoc debugging. Evaluation scores outputs against your eval set. Guardrails enforce boundaries on autonomous behavior.
OpenTelemetry's emerging generative-AI semantic conventions matter here. They give vendor-neutral trace and span schemas, so you are not locked into a single observability vendor. Capture cleanly from day one and your traces stay portable.
Start With These Three Metrics Today
If you take nothing else away, start tracking these three:
- Token consumption per session — controls cost.
- Step-level failure rate — finds the weak link in your cascade.
- Task completion rate — the quality metric that ties to business value.
Watch these for a week before buying any new tooling. They will tell you where the real problems are.
Conclusion
Production agents fail differently than normal applications. They burn hidden cost in reasoning loops, fail silently, and cascade through multi-step workflows. The metrics that keep them profitable are token consumption per session, step-level failure rate, and task completion — measured at session level, with P99 latency and evaluation loops layered on top.
Once your metrics are honest, your agents become measurable, debuggable, and continuously improvable. That is the difference between an agent that is a demo and an agent that is an asset.
If you are moving LLM agents into production — or fighting to control the ones already there — this kind of planning is exactly why you should subscribe. We publish practical production-AI playbooks like this regularly, covering the reliability and cost engineering most vendors skip.
Expert Q&A
Q: What is the single most important metric to start tracking if I have budget to instrument only one thing today? A: Track token consumption per session first. It is the metric that uniquely binds cost and reliability. A per-session token spike is the earliest signal of both a runaway reasoning loop and a prompt-injection or tool-churn failure. It is cheap to capture, correlates with real spend, and surfaces problems before users report them. Once you have per-session cost visibility, layer on step-level failure rate as the second priority.
Q: How do I detect silent failures — confident but wrong outputs — before end users hit them? A: Static alerting on error codes will not catch them, because they do not error. You need a quality-scoring layer: run an LLM-as-a-judge on a sampled share of live traffic to measure hallucination frequency and grounding accuracy for RAG agents. Combine that with trajectory tests in your eval loop. The pragmatic approach is to sample aggressively in shadow mode first — score outputs, log scores, and only later gate on them — so you build trust in the judge before it blocks anything.
Q: When does self-hosting actually save money versus a managed API? A: Model the breakpoint rather than guessing. Self-hosting wins when your GPU utilization stays above roughly 50% sustainably, which typically means workloads generating 50-100 million tokens a month. Below that, managed APIs win on economics and free up engineering time. Before buying GPUs, measure your real month-over-month token volume and grasp your actual concurrency — many teams over-provision on projected peak load and end up with idle, expensive hardware.
Q: How often should I run evaluation loops, and can they hurt by slowing releases? A: Run the regression eval set on every change — every prompt edit, model swap, tool definition change, and deployment. That is the entire point: a fast, deterministic gate on known failure modes. For live scoring, sample continuously rather than batch-cycling weekly so drift is caught quickly. The risk is not the evals themselves; it is curating stale or noisy test cases that start failing for the wrong reasons. Treat your eval set as versioned code you maintain, not a set-and-forget artifact.
Q: What is the difference between per-request and per-session metrics, and why does it matter for agent workloads? A: A request is a single model turn; a session is the entire multi-step workflow from user intent to resolution. For agents they diverge sharply — one user request can spawn ten tool calls and model turns. Per-request metrics hide the aggregate cost, the compounding latency, and the cascading failure probability that per-session metrics expose. If you only watch per-request figures, an agent that burns 20X the intended tokens or fails step 6 of 8 looks perfectly healthy.
Q: How do I keep LLM-as-a-judge evaluation itself from inflating my cost? A: Judge calls are a real cost. Control it three ways: sample a statistically meaningful but bounded share of traffic (for example, 5-10% plus 100% of flagged or high-risk cases); cache judge outputs by input hash where safe; and prefer smaller, cheaper judge models for most scoring, escalating to a stronger model only on disagreement or boundary cases. Track judge cost as its own line item so the measurement layer does not silently undermine the savings it exists to deliver.