Observability and Evaluation for Production LLM Agents: The 2026 MLOps Playbook
For years, "production monitoring" meant a familiar dashboard: uptime, latency, error rate, saturation. If a service was up, fast, and error-free, it was health
For years, "production monitoring" meant a familiar dashboard: uptime, latency, error rate, saturation. If a service was up, fast, and error-free, it was healthy. That playbook worked for decades of conventional software — and it collapses the moment an LLM agent enters production.
I've watched a lot of teams discover this the hard way in 2026. They ship an agent, wire up the usual metrics, and then something goes wrong that no classic alert catches. The agent is up. It's fast. And it's quietly doing the wrong thing — taking a wrong action, hallucinating from a bad retrieval, or burning through tokens at a scale that nobody noticed until the invoice arrived.
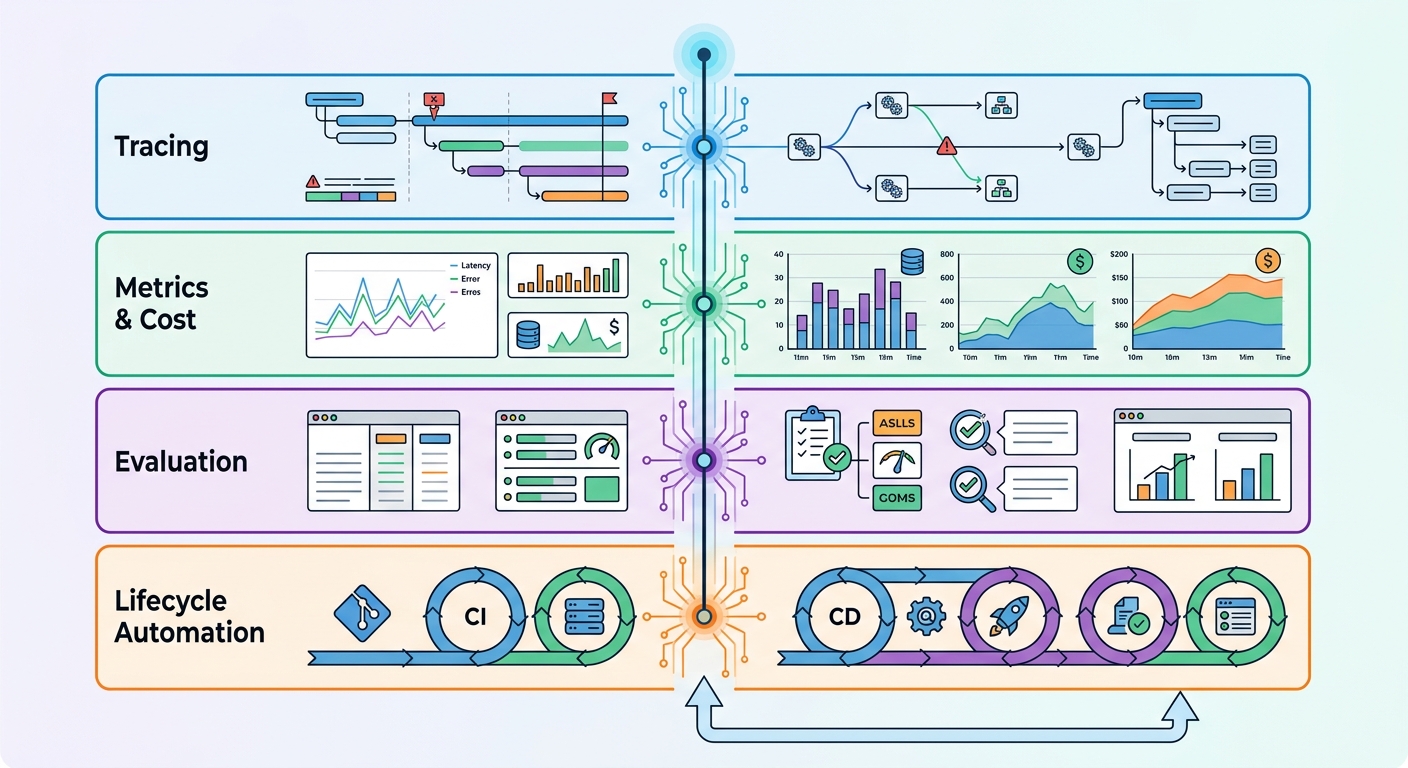
The fix is not a better uptime dashboard. It's a fundamentally different discipline. This article lays out the 2026 playbook: why agents break traditional observability, and the four synchronized layers — tracing, metrics & cost, evaluation, and lifecycle automation — that separate production-grade agentic systems from demos.
Why Agents Break Traditional Observability
Start with the structural reasons the old playbook fails. LLM agents are not conventional services, and treating them as such means monitoring the wrong signals.
They are non-deterministic. The same input can produce different outputs on different runs. "Reproduce the bug" — the foundation of conventional debugging — is nearly impossible without capturing the exact conditions of each run.
Their errors compound. A failure in an early planning step cascades through tool calls, retrievals, sub-agent handoffs, and orchestration logic. The visible symptom at the end rarely points to the actual root cause a few steps back.
They have real side effects. Agents don't just return text. They write to databases, call APIs, and trigger payments. So a failure is not "wrong text" — it can be a wrong, irreversible action in the world.
Cost is a runtime signal. Every token is a cost line, and agents burn tokens by the container-load. Cost in an agent system is not an accounting detail; it's a first-class signal that belongs in your monitoring surface.
The practical consequence: the classic "golden signals" have to be re-tooled. Token throughput replaces generic traffic. Time-to-first-token (TTFT) matters more than total page latency. Tool-call success rates, retrieval relevance, and — crucially — quality and safety scores matter at least as much as uptime.
The shift: you can't observe an agent by watching a single service. You have to trace the entire execution graph, from prompt to final action, across every internal and external component.
The Thesis: Trace, Measure, Evaluate, Close the Loop
Before the tooling, the mental model. The 2026 playbook rests on a single operational truth that anchors everything that follows:
An agent you cannot trace, measure, evaluate, and version is an agent you cannot trust.
That breaks into four layers that must work together across the whole lifecycle:
- Tracing — OpenTelemetry as the vendor-neutral spine.
- Metrics & cost — an LLM-native monitoring surface.
- Evaluation — from "did it answer" to "did it do the right thing."
- Lifecycle automation — AgentOps CI/CD, guardrails, and feedback loops.
The connective tissue holding all four together is traceability — the ability to link any failure or degradation in production back to the exact prompt, model version, and dataset version that produced it. Without that thread, each layer is a silo. With it, you have a closed loop where production realities feed directly back into what gets tested before the next deploy.
Layer 1: Tracing With OpenTelemetry as the Spine
The foundation of any 2026 stack is OpenTelemetry (OTel), now the de facto vendor-neutral standard for traces, metrics, and logs. Its GenAI Semantic Conventions — actively maturing through 2026 — standardize how you capture LLM-specific signals: inference calls, token usage, latency, cost, and agent/tool interactions.
The strategic benefit of OTel is not the plumbing; it's escaping vendor lock-in. You instrument once against the standard, and your telemetry can flow to any compatible backend — Langfuse, Datadog, Grafana, or self-hosted — without rewriting your instrumentation. That portability matters in a year when tooling choices are shifting fast.
Tracing best practices that separate useful traces from noise:
- Capture end-to-end journeys: every LLM call, tool invocation, RAG retrieval, memory operation, and decision point.
- Link every step so the full execution graph is reconstructable after the fact.
- Record prompts and completions using the semantic conventions (
gen_ai.input.messages/gen_ai.output.messages). - Sanitize sensitive data in the tracing wrapper — PII/PHI redaction is a compliance requirement, not an afterthought.
- Apply sampling rates on high-volume services; you don't need to store every pair.
- Enable replay — store enough (input artifacts, intermediate outputs, config state) to reproduce a failure offline.
Tracing is the diagnostic spine: it's how you find prompt failures, tool malfunctions, retrieval issues, and orchestration bugs systematically — not by guesswork and not by staring at a red uptime graph.
Layer 2: Metrics, Cost, and LLM-Native Golden Signals
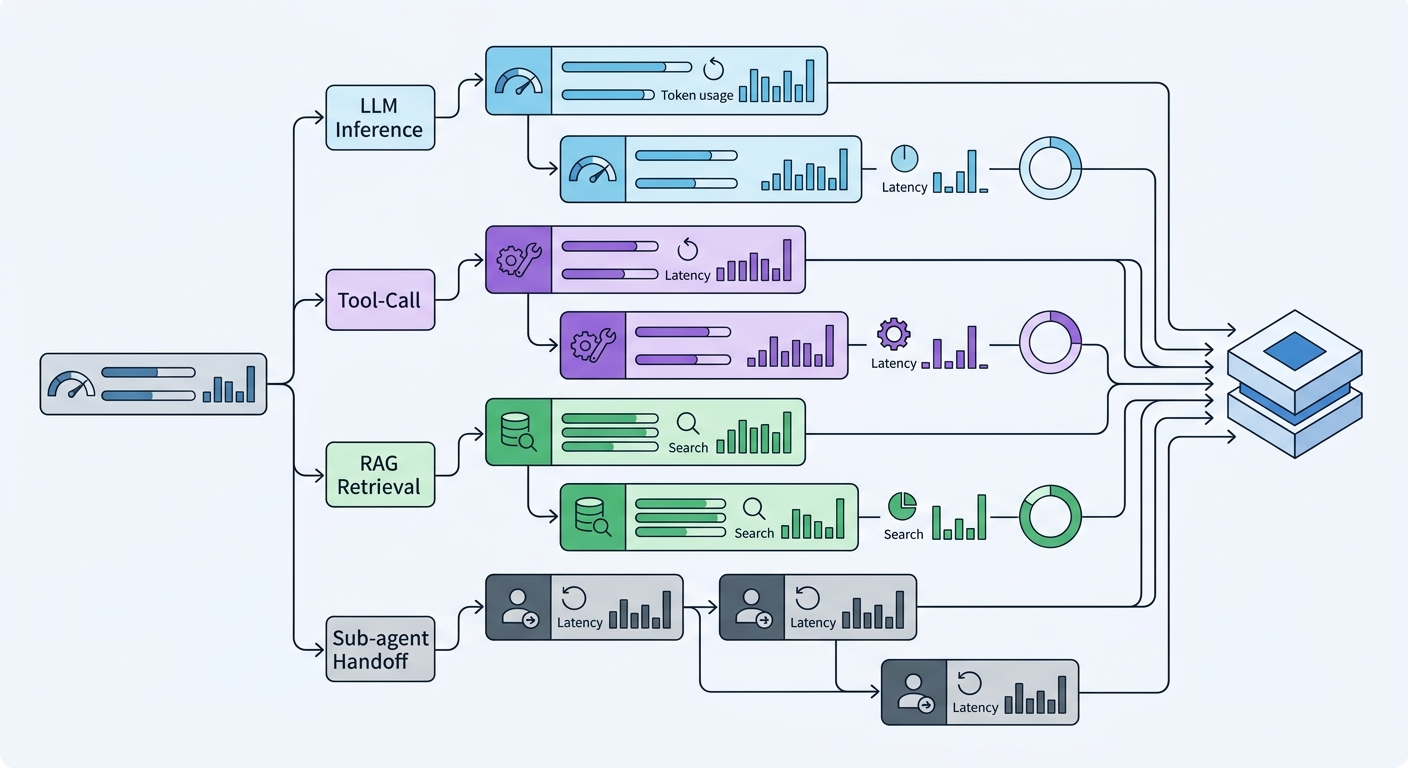
The second layer is defining what to measure, because classic SRE metrics will mislead you. Build an LLM-native monitoring surface instead:
- Token accounting — tokens per agent, per run, per user; per-step versus total; prompt-cache hit ratio.
- Latency — time-to-first-token (TTFT) and time-to-last-token (TTLT), per-step latency, end-to-end agent completion time.
- Cost — spend per model/provider, per agent, per user; budget alerts; per-user token budgets and rate limits to stop spikes.
- Quality — hallucination rate (via automated judges), drift flags, guardrail-trigger rates, human feedback scores.
- Operational — tool-call error and success rates, retries, sub-agent handoff failures, retrieval relevance.
The crucial habit is the behavioral baseline. Establish a baseline for each signal and alert on deviation. An agent that starts producing longer, more expensive, less faithful outputs is drifting — even if its uptime is perfect. Uptime tells you the service is running; the LLM-native surface tells you whether it's behaving.
Layer 3: Evaluation: From "Did It Answer" to "Did It Do the Right Thing"
The richest change in 2026 is in evaluation. Classic evaluation asked, "did the model produce a correct answer?" Production agent evaluation asks a far harder question: "did the agent do the right thing — through the whole chain?"
What you should measure:
- Task completion / goal success — did the agent actually achieve the user's objective?
- Trajectory-level metrics — step efficiency, argument correctness, tool correctness, plan adherence, plan quality, reasoning relevancy, coherence across steps.
- RAG metrics for retrieval-driven agents — Faithfulness, Answer Relevancy, Contextual Precision, Context Recall.
- Safety — bias, toxicity, harmful content, policy compliance.
And you run it in three modes, because each answers a different question:
| Mode | What it inspects | When to run it |
|---|---|---|
| End-to-end | The agent as a black box; overall task success | Release gating, baseline |
| Trajectory-level | Plan, reasoning, tool calls, retries, handoffs | Deep diagnostics, regression |
| Component-level | Isolated retrievers, models, sub-agents, RAG | Pinpointing failure sources |
On methods: LLM-as-judge is scalable and cheap, but you must calibrate it against humans to control judge bias. Reference-free metrics (RAGAS-style) reduce dependence on hand-labeled datasets. And human-in-the-loop (HITL) is not a phase you bolt on — it's an architectural component, especially as agents act on users' behalf and you need humans to judge tone, domain accuracy, and policy compliance that automated judges can't reliably assess.
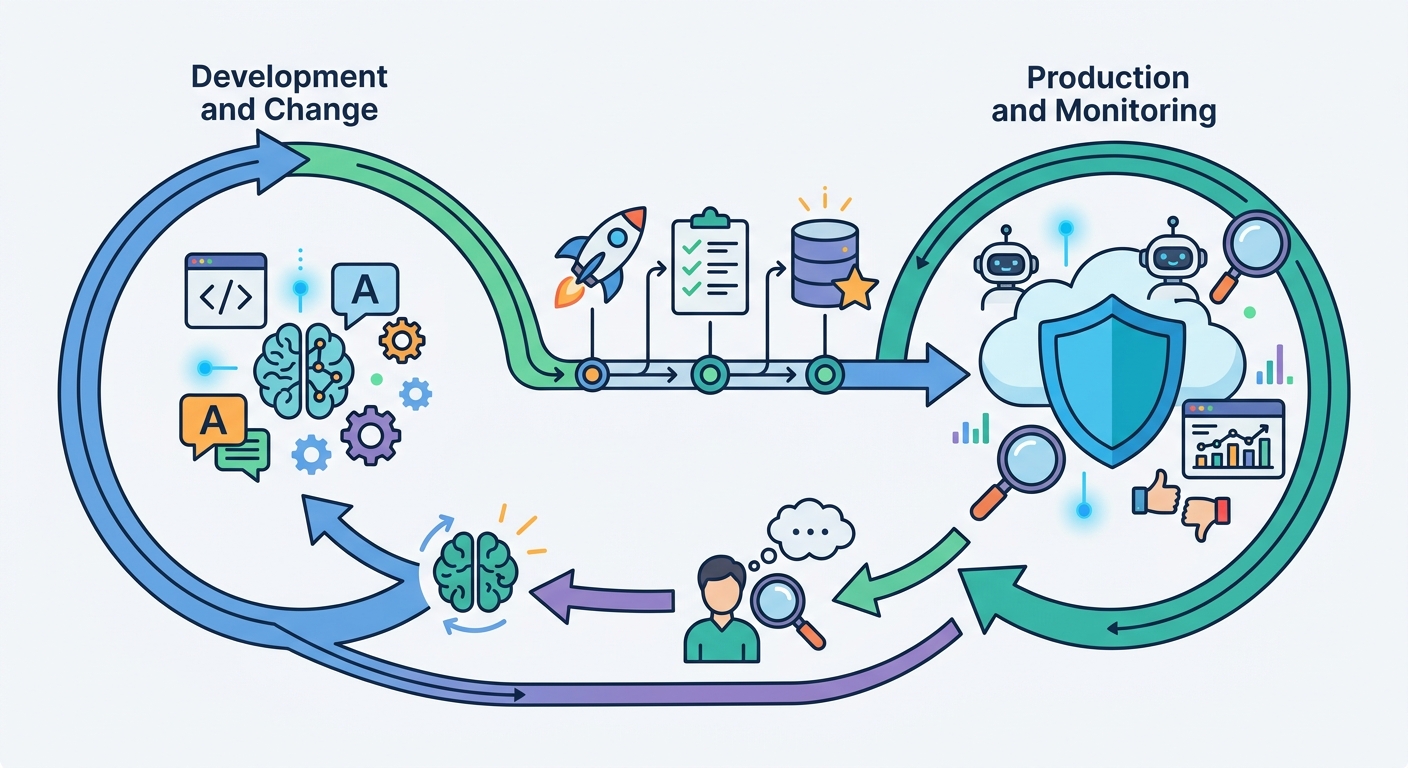
Close the loop: every production failure becomes a new regression test. When tracing reveals an agent did something wrong, that failure should land in your development eval suite before you ship the next version. That single habit is how struggling teams turn into compounding-advantage teams.
Choosing Your Stack: 2026 Tooling Snapshot
Here's how the theory lands in real tooling choices — framed as a map tied to the layers, not an endorsement of any single product. The good news is you don't need one tool to do everything; you need a coherent set that covers the four layers.
| Tool | Where it fits |
|---|---|
| LangSmith | Offline + online evals, LLM-as-judge, HITL annotation, dashboards |
| Langfuse | Open-source, OTel-based tracing with integrated eval scores, self-hostable |
| Confident AI / DeepEval | Pytest-native evals, 50+ research-backed metrics, CI/CD integration |
| Arize Phoenix | Span-level tracing, real-time dashboards, ML monitoring heritage |
| MLflow | Broad open-source coverage, rule-based + LLM-judge metrics, human review |
| RAGAS | RAG-specialized reference-free metrics + synthetic test-data generation |
| Galileo / Evidently / LangWatch / Deepchecks | Specialized agent and quality evaluation |
One benchmark note matters for how you evaluate: the test set itself is shifting. 2026 teams are abandoning saturated academic benchmarks like MMLU in favor of harder, realistic agentic suites — function calling, tool use, browsing, multi-step workflows — where GPQA and agentic suites are the new floor. Evaluate your agents on the work your agents actually do, not on textbook trivia.
Layer 4: The AgentOps Lifecycle: CI/CD, Guardrails, and Feedback
The fourth layer is where observability crosses over into AgentOps — managing stateful, multi-step, autonomously-acting systems as a lifecycle, not a one-time deploy.
CI/CD for LLMs. Version large artifacts (gigabytes to terabytes of data and models) with proper storage. Run golden-dataset evals as your automated tests: prompt unit tests, integration tests for agent chains, and regression evals on curated datasets. Automate redeploy when monitored metrics drop below threshold, and build the post-deploy feedback loop so monitoring data, token usage, latency, and HITL labels flow back into fine-tuning.
Guardrails at input and output. Programmable policies that control agent I/O: input validation (block prompt injection), hardened prompt construction, output validation (factual grounding, no harmful or non-compliant content), RBAC on retrieval (agents only touch data their user is permitted to see), and behavioral-consistency monitoring that watches qualitative output, not just uptime.
Instrument against the real failure modes. Hallucinations are structurally tied to retrieval context and data governance — ungoverned RAG sources inflate fabrication rates, and debugging them requires replaying the exact code, model version, and live data. Drift is the subtle regression from model updates or prompt tweaks that surfaces only when downstream logic breaks — which is why continuous semantic monitoring matters more than snapshot checks. And prompt injection / shadow AI are security and governance events that must be traced and alerted on, not just logged.
Latency and Cost as Design Variables
Finally, the economics layer — and it's the one that makes observability pay for itself. An agentic task burns 5–30x the tokens of a chatbot (and sometimes more), so even with falling token prices, per-task cost is a design variable, not a surprise you discover on a bill.
On latency: generate fewer tokens (concise prompting, structured output), fuse sequential steps into single prompts, parallelize independent sub-steps, right-size the model (small and fast for easy tasks), compact prompts with semantic caching, and stream tokens so TTFT becomes the perceived-latency metric.
On cost: use model routing (cheap model for simple queries, frontier model only when required), prompt caching for repeated contexts, output token caps, aggressive context trimming, batching, per-user token budgets with rate limits, and continuous spend monitoring with anomaly detection to validate that your routing is actually working. Each of these is only possible if your metrics layer is measuring cost per agent, per task, per model — which is exactly what the observability stack above gives you.
The 2026 Playbook: Minimal Stack and Rituals
If you're starting from scratch, here's the tightest production-ready starting point:
- Instrument once with OpenTelemetry (GenAI semantic conventions) on day one.
- Trace everything into Langfuse (self-hosted for control) or LangSmith.
- Eval in three modes: offline on golden datasets in CI, online on live traffic for drift and quality, and HITL annotation queues.
- Guardrails at input and output across every agent entry point.
- Dashboards for LLM golden signals: token spend, TTFT, cost per agent, hallucination rate, tool-call success, drift baselines.
- A feedback loop that turns every production failure into a regression test and feeds HITL labels back into tuning.
The core rituals are just as important as the tools: instrument before you ship, define success metrics and behavioral baselines before launch, run evaluation in CI/CD on every prompt or model change, replay-and-debug incidents from trace data, and review cost-per-task and token budget adherence weekly.
Conclusion
Strip away the tooling and the 2026 MLOps playbook rests on one operational truth: an agent you cannot trace, measure, evaluate, and version is an agent you cannot trust. The winning teams ship OpenTelemetry-based tracing, LLM-native metrics and cost controls, layered evaluation with human-in-the-loop, hardened guardrails, and a closed feedback loop — together, that is what "AgentOps" actually means.
As agents grow more autonomous, observability and evaluation stop being back-office concerns. They become the primary risk controls for everything an enterprise entrusts to AI — and the primary engine of continuous improvement that compounds with every deploy.
If you're building production LLM agents and want implementation-focused research on observability, evaluation, and the rest of the AI infrastructure stack, subscribing to the portal keeps you ahead of the curve. The teams that make agents visible, measurable, and traceable from day one will be the ones shipping reliably while everyone else is still chasing ghosts through uptime dashboards.
Expert Q&A
Q: Our agent has 99.9% uptime, but it periodically does the wrong thing — e.g., hallucinating an action or calling a tool with bad arguments. Our classic dashboards show nothing. Where do we start? A: Stop looking at your uptime dashboard and start looking at traces. The wrong-but-fast failure you're describing has three likely roots — a retrieval-quality problem (ungoverned RAG context feeding the hallucination), a tool-call/argument bug, or a plan-adherence failure where the agent drifts off the intended trajectory. To find it, you need Layer 1 (OTel tracing with tool-call and retrieval spans) plus Layer 2's behavioral baseline: alert on deviation in hallucination rate, tool-call success, and quality scores, not on uptime. Replay the exact run from trace data to isolate which span the wrong action came from, then turn that incident into a regression test. Uptime is telling you it's running; the LLM-native surface is what tells you whether it's behaving.
Q: Does it matter which observability backend I pick, or is OpenTelemetry the whole answer? A: OTel is the answer for the instrumentation layer; it deliberately does not dictate the backend. The strategic value is portability — you instrument once against the GenAI Semantic Conventions and your telemetry can flow to Langfuse, Datadog, Grafana, Arize, or a self-hosted sink without a rewrite. So pick a backend for the features you need (tracing volume, eval-score integration, dashboards, on-prem control for data residency), not as a lifelong commitment. If regulatory control is a requirement, a self-hostable option like Langfuse removes the cloud-exposure question. The mistake is building instrumentation that is welded to one vendor's SDK and then discovering you can't move when the tooling landscape shifts.
Q: Is LLM-as-judge trustworthy enough to gate releases, or do I still need human review everywhere? A: LLM-as-judge is scalable and cheap, but it is a biased instrument until you calibrate it — against humans, on your own data, before you trust it as a gate. Treat it as an approximation that's great for high-volume signal and drift detection, not as a ground truth for everything. And some judgments are not delegable to any automated judge: tone, domain accuracy against proprietary context, and policy compliance when the agent acts on a user's behalf. That's why HITL is an architectural component, not a bolt-on phase. The pragmatic split is: automated judges for volume and speed, calibrated against a human-labeled benchmark, with a human review queue reserved for risky actions and edge cases.
Q: We keep shipping fixes but the same classes of failures recur. What's the missing habit? A: The one habit that separates compounding-advantage teams from firefighting teams is: turn every production failure into a new regression test. When a trace reveals an agent did the wrong thing, that exact scenario should land in your development eval suite before you ship the next version. If you don't do this, you're replaying the same debugging loop — and worse, a model or prompt update can silently re-break a failure you already "fixed." Combined with eval-in-CI on every prompt or model change, this converts observability from a reactive alarm into a forward-looking guardrail. If the same failure class keeps recurring, the root cause is almost always that your regression suite and your production observability aren't connected.
Q: The CFO is asking why my agent is costing 20x more per task than a chatbot. Is that just the nature of agents? A: Some multiple is inherent — an agentic task legitimately burns 5–30x the tokens of a chatbot (and sometimes more) because it plans, calls tools, re-injects context, and refines. But a 20x line item should be interrogated, not accepted. Treat per-task cost as a design variable: is a frontier model running where model routing (cheap for simple, frontier only when required) would do? Is prompt caching in place for repeated context? Are you enforcing output caps, context trimming, and per-user token budgets with rate limits to stop spikes? Are independent sub-steps parallelized to cut latency? Each lever is only controllable if your metrics layer measures cost per agent, per task, per model — which is exactly what your observability stack gives you. If you can see the breakdown, you can drive the bill down.
Q: We're building our first production agent from scratch. What's the minimal stack we should not skip? A: Start with Layer 1 and instrument with OpenTelemetry on day one — do not ship uninstrumented and retrofit. Then trace into a backend you control (self-hosted Langfuse for control, or LangSmith; both fit). Add golden-dataset evals in CI across the three modes — offline, online for drift, and a HITL annotation queue — plus guardrails at input and output on every entry point. Build the LLM-native dashboards: token spend, TTFT, cost per agent, hallucination rate, tool-call success, drift baselines. And wire the feedback loop so every production failure becomes a regression test and HITL labels flow back into tuning. That's the whole playbook — six pieces, working together. Skipping any one of them is how you end up discovering wrong-but-fast behavior on an invoice.
FAQ
Why do classic SRE monitoring techniques fail for LLM agents? Agents are non-deterministic, their errors compound across steps, they have real side effects (writes, payments), and their cost scales with tokens. Classic uptime/latency/error-rate dashboards miss wrong-but-fast behavior entirely.
What are the four layers of the 2026 observability playbook? Tracing (OpenTelemetry as the vendor-neutral spine), metrics & cost (an LLM-native monitoring surface), evaluation (from "did it answer" to "did it do the right thing"), and lifecycle automation (AgentOps CI/CD, guardrails, feedback loops), all connected by traceability.
What are the LLM-native golden signals I should track? Token accounting and cost per agent/task/model, TTFT and TTLT latency, hallucination rate, tool-call success and retrieval relevance, drift baselines, and quality/safety scores — plus budget alerts and per-user token limits.
How should I evaluate an agent versus a classic model? Run evaluation in three modes — end-to-end, trajectory-level, and component-level — measuring task completion, plan/tool correctness, RAG metrics, and safety. Close the loop by turning every production failure into a new regression test.
How do I keep agent latency and cost under control? Treat per-task cost as a design variable: model routing, prompt caching, output caps, context trimming, and per-user budgets, with continuous spend monitoring. Latency improves via concise prompting, step fusion, parallelization, right-sized models, and streaming tokens.