LLM Observability & Evaluation in Production: Tracing, Evals, and Guardrails
Shipping an LLM application that works in a demo is easy. Keeping it reliable, safe, and on budget at production scale is an entirely different discipline. Mode...
Shipping an LLM application that works in a demo is easy. Keeping it reliable, safe, and on-budget at production scale is an entirely different discipline. Models return different answers to the same prompt. They fabricate facts confidently. They drift as providers ship new versions. And each request burns tokens that show up on the invoice.
That is why a new operating discipline — LLMOps — has emerged. It rests on three pillars that teams too often treat as separate projects: LLM observability, evaluation, and guardrails. In practice they form one loop. Traces show you what happened. Evals tell you whether it was good. Guardrails stop the bad before it reaches users. When they are connected, you get something traditional monitoring never offered: control over a non-deterministic system.
This guide walks through each layer and, more importantly, how to wire them together so your production LLM stays trustworthy.
Why LLM Apps Fail Differently Than Traditional Software
Traditional software is deterministic. The same input produces the same output, every time. If a service breaks, there is a stack trace, an error code, and a line of code to blame.
LLM applications break this contract. The same prompt can produce a correct answer, a subtly wrong one, or a confident hallucination depending on sampling, temperature, and model version. Output quality is subjective — there is frequently no single "right" answer to evaluate against.
The failure modes also shift. Instead of crashes and timeouts, you face hallucinations, prompt injection, and gradual drift. Instead of predictable compute costs, you face token-based bills that spike with usage. Traditional application performance monitoring (APM) is not enough — it watches for errors that look like red squiggles on a chart, but an LLM can produce fluent nonsense with a perfect 200 response and zero stack traces.
Key insight — The hardest LLM failures are invisible to classic monitoring: the request succeeds, the latency is fine, and the answer is simply wrong. That is why observability, evals, and guardrails must be built into the system, not bolted on.
To operate these systems, you need a dedicated stack. Here is how the three layers work.
Building an LLM Observability Layer: Metrics, Logs, and Tracing
LLM observability means seeing what the model actually did, step by step, and whether the outcome was good. It has three layers: metrics, logs, and traces.
Metrics give you the numbers to alert on. Quantitative ones include latency, token usage, error rate, and cost per request. Qualitative ones are the reason this is different: faithfulness, groundedness, and a hallucination rate baseline. If you do not know your baseline hallucination rate, you cannot tell when the model has gotten worse.
Logs capture the full context of every interaction. For each call, log the complete prompt — system and conversation history — plus the response, the model name and version, a request ID, timestamps, token counts, and an anonymized session ID. The rule of thumb is: log everything it takes to reproduce the request later.
Tracing is what separates serious LLM observability from basic logging. In agentic systems, a single user request fans out into model calls, tool invocations, and agent handoffs. Hierarchical tracing reconstructs the full decision path using parent-child spans: the agent session is the root span, reasoning steps are child spans, and tool calls nest underneath. When something fails, you can pinpoint whether the bad output came from the model, the retrieval, or the routing logic.
Open standards now exist to make this portable. OpenInference provides a shared schema for AI application tracing, so you are not locked into any single vendor.

With observability in place, you have the raw material to judge quality. That is where evaluation comes in.
Evaluating LLMs in Production: The Multi-Layer Eval Stack
LLM evaluation is how you decide whether an LLM output is actually good. Production teams do not rely on one metric — they build a stack with three layers that catch different kinds of problems.
Automated metrics — exact match, F1, BERTScore — are fast and cheap. Run them continuously to catch regressions the moment they appear. They are blunt instruments, though: they cannot judge whether a generated paragraph is coherent or grounded.
LLM-as-a-judge uses a second model to grade the first at scale. It provides directional quality signals across a large sample, catching issues that string-matching misses. It is the workhorse of production evaluation, with the reliability caveats covered below.
Human evaluation establishes ground truth. It is slow and expensive, but nothing else catches nuanced failures — tone, cultural fit, subtle factual inaccuracy. Reserve it for the highest-stakes categories.
Crucially, you must evaluate the whole application, not just the model call. A production LLM app involves routing, retrieval, tool use, memory, and multi-turn behavior. Testing the isolated prompt misses failures that only appear when components interact.
The benchmarks matter too. Generic public benchmarks rarely reflect your domain. Curate an evaluation set from your own knowledge base, policies, and real customer journeys — the queries your users actually ask. That is the set that predicts production behavior, and it should live in your CI/CD pipeline with fail-the-build semantics: if scores drop past a threshold, the deploy stops.
Key insight — Evaluation is not a pre-launch checkpoint. It is an always-on process. The models you deploy change under you, so the eval suite must run on every commit and keep watching in production.
Making LLM-as-a-Judge Trustworthy
An LLM judge is only useful if you can trust its verdicts. Blindly trusting a judge's score is how bad models sneak past review. Several techniques make judging reliable:
- Give the judge explicit evaluation_steps — a numbered rubric — instead of an open-ended question.
- Use strict_mode for binary pass/fail checks so the judge cannot hedge.
- Break complex criteria into branches using a DAG (directed acyclic graph) metric, where each criterion is scored independently before combining.
- Validate judge scores against human annotations on a sample to make sure the judge agrees with ground truth.
- Inspect the judge's score reasons, not just the number, to catch judge errors.
These are small changes, but these techniques convert an unreliable vibe-check into a signal you can alert on.
Measuring RAG Quality: Retrieval and Grounding
Retrieval-augmented generation (RAG) — pulling relevant context from a knowledge base before generating — is the most common way to ground LLMs. But it introduces a two-part failure problem. The answer can be wrong because retrieval fetched the wrong chunks, or because generation ignored the right ones. You must score these separately.
Three metrics cover the ground:
- Faithfulness — is every claim in the answer supported by the retrieved context? Faithfulness metrics detect hallucinations grounded in context.
- Context relevance — did the retriever pull the right, useful chunks in the first place?
- Answer relevance — does the final answer actually address the user's question?
Key insight — A RAG pipeline can score perfectly on retrieval and still hallucinate because generation ignored the context — or it can retrieve badly and still answer well by luck. Scoring faithfulness, context relevance, and answer relevance independently tells you which stage to fix.
Open-source frameworks like Ragas and DeepEval implement RAG evaluation metrics on top of LLM judges, giving you a workable baseline without building everything from scratch. The point is to make grounding measurable, because you cannot fix what you cannot see.
Guardrails: The Runtime Safety Layer
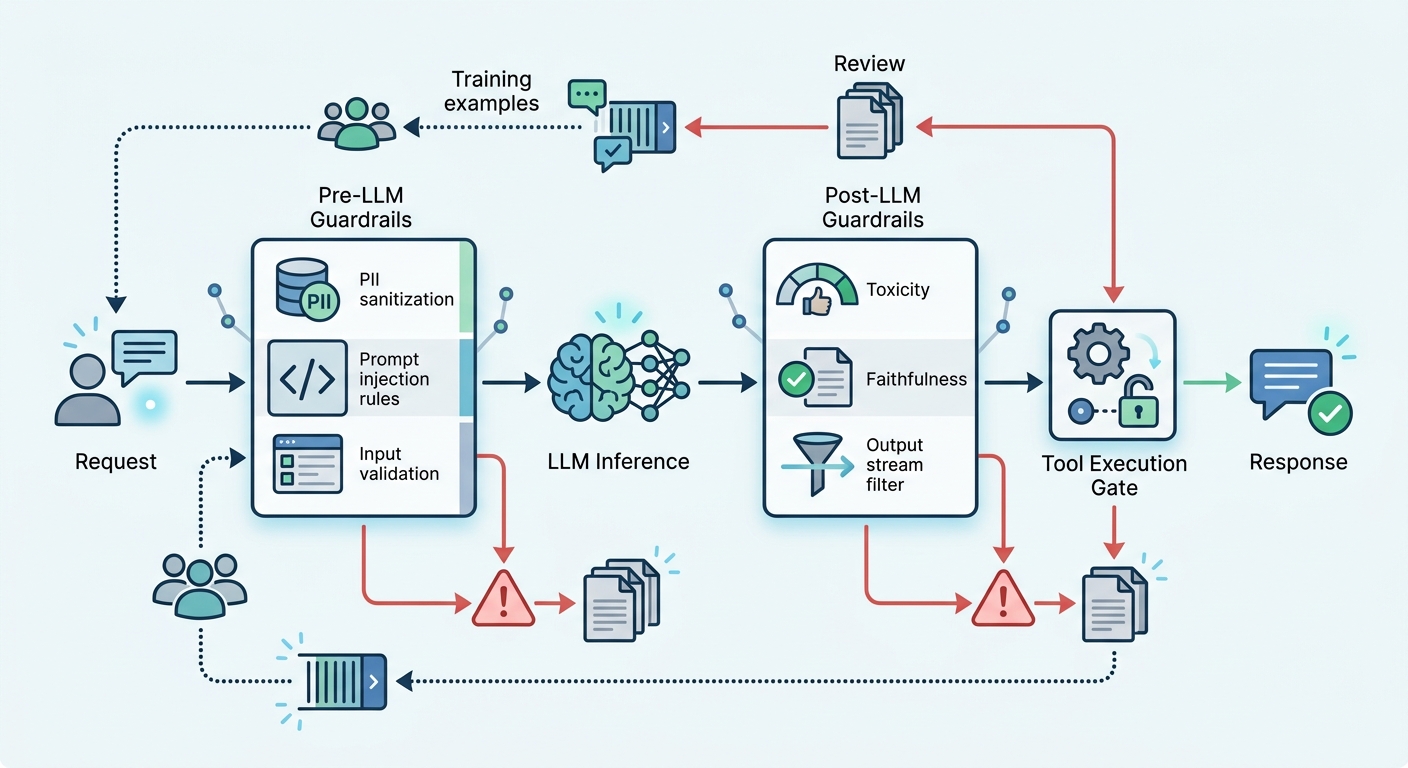
Even with great evals, you need something sitting in the path of every request to stop bad output before it ships. That is the guardrail layer. AI guardrails are runtime controls — execution logic inside the request loop, not just a pre-launch test.
The architecture splits into two stages with very different cost profiles.
Pre-LLM guardrails run before the model does, in the hot path on every request. Keep them fast and deterministic: regex-based PII detection, rule-based prompt injection checks, and input validation. There is no LLM call here, so they add microseconds.
Post-LLM guardrails run after generation. Because they may invoke another model to check for toxicity, hallucination, or sensitive content, they add real latency and cost per request. Budget accordingly. This is also where tool-call and execution gating lives — refusing to let the model execute a tool call that violates policy.
To make guardrails production-grade, you need two curated test sets: 500–2,000 known attacks (from public jailbreak catalogs and your own production attempts) and 2,000–10,000 legitimate customer requests. Then measure two separate things:
- Recall — what fraction of attacks are caught. Aim for 95%+ on safety-critical categories.
- Precision — how often legitimate requests are wrongly blocked. Aim for 99%+ non-over-blocking.
Wire these into your build pipeline and fail the build if performance drops.
An AI gateway is the cleanest way to centralize all these controls. It sits in front of your model providers and enforces authentication, PII scrubbing, rate limiting, and safety filtering before any request reaches the model — a zero-trust AI posture where the model is treated as an untrusted endpoint.
Connecting the Loop: From Observability to Action
Here is where the disciplines stop being separate projects. When designed as one system, each layer feeds the others.
Traces feed evals. New production traffic is a never-ending source of real evaluation cases. Sample traces, label them with ground truth, and drop them into the eval set.
Eval failures trigger guardrail tuning. When an eval flags a new jailbreak or a hallucination pattern, that becomes a guardrail rule and an alert. Every regression is a learning signal.
Alerts drive incident response. When a metric or eval fires, the trace lets you replay the exact failed run. Time-travel debugging — pausing, branching, and replaying an agent execution — isolates non-deterministic errors that are nearly impossible to reproduce by guessing.
Cost governance closes the loop. Track token spend per agent, per run, per user. If one workflow costs ten times what you budgeted, the trace shows you exactly which calls — and which model versions — are eating the budget.
Key insight — The trace → eval → guardrail loop is what makes a non-deterministic system manageable. Each bad output becomes data: traced, evaluated, blocked, and fed back to improve the next run.
Compliance and Privacy in the Observability Stack
All that logging has a regulatory price. Privacy laws like GDPR and CCPA constrain what you can store, and the EU AI Act increasingly demands that high-risk AI systems be auditable and monitored.
The practical consequence: mask PII before it touches storage. Anonymize user and session IDs, redact credentials, and strip sensitive spans of text. Do the sanitization inside your instrumentation wrapper so traces are clean by the time they reach the observability backend — not as a post-processing step you will forget.
Retention and access controls matter too. Decide how long raw prompts and responses are kept, who can read them, and how they are deleted on request. The OWASP LLM Top 10 provides a useful checklist of the security risks to design against, from prompt injection to sensitive-information disclosure.
Start Small: A Practical Adoption Path
You do not need to build all three layers in week one. A staged path reduces risk and shows value fast.
Stage 1 — See what is happening. Add structured logging for every LLM call, plus one eval suite wired into CI with fail-the-build semantics. Continuous evaluation catches regressions before they reach production. You now have a baseline.
Stage 2 — Understand the why. Add tracing for agentic systems and drift alerts. Model drift signals behavior changes across versions. When something degrades, you can now trace it to the model, retrieval, or routing.
Stage 3 — Prevent the bad. Add guardrails and an AI gateway in the hot path. Block attacks and bad output before they reach users.
Start with the failure that hurts most. If hallucinations are your pain point, prioritize faithfulness evals. If security is the concern, lead with guardrails and the gateway. If unpredictable cost is the issue, build token accounting first.
The goal is not to deploy a perfect system on day one. The trace → eval → guardrail loop is what to build toward — and keep tightening as production traffic teaches you where your model actually breaks.
If you are building out your LLMOps stack, keep notes on what worked for your team and what you would do differently. And subscribe for more practical deep dives on running AI systems reliably in production.
Expert Q&A
Q: How do I decide between building an eval harness in-house versus using an observability platform's built-in evals?
A: Start with the platform's built-in evals to get signal fast, but treat them as a starting point, not a destination. Platform evals are generic — they grade general quality, not your specific domain constraints. The moment you need to verify a domain rule — like "the order total must match the sum of line items" — you will need a custom evaluator. A pragmatic split: use platform tooling for broad quality signals (toxicity, faithfulness) and write custom checks for business-critical invariants. Keep your golden eval set as an independent artifact you own, regardless of vendor, so you are not locked in.
Q: What is the most common mistake teams make when first rolling out LLM-as-a-judge?
A: Giving the judge an open-ended prompt and trusting its single score number. Without explicit evaluation_steps, a rubric, and strict_mode for pass/fail, the judge becomes a loose vibe-check that drifts with phrasing. The second most common mistake is never validating the judge against human annotations — teams deploy a judge that disagrees with ground truth on 30% of cases and never find out. Always run a human-validated sample through the judge before trusting any alert threshold on it.
Q: My guardrails are blocking too many legitimate requests. How do I tune without opening the door to attacks?
A: This is the recall/precision tension, and the fix is to track them separately, never as a blended score. Keep recall on known attacks at 95%+ while measuring precision on legitimate traffic. When precision drops (too many false blocks), look at what the blocking rule is matching — usually an over-broad regex or a heuristic that flags benign phrasing. The review queue is your tuning tool: send blocked requests to human review, and use the accepted/rejected labels to tighten rules. A useful baseline is 99%+ precision on legitimate requests while maintaining high recall on the attack set.
Q: Should I use separate guardrail tools or route everything through an AI gateway?
A: Start with guardrail tooling directly in your application logic, because it is simpler to debug and iterate. Move to an AI gateway when you have multiple applications, multiple model providers, or a need to centralize authentication, PII scrubbing, rate limiting, and safety filtering in one place — a zero-trust posture. Many teams converge on: guardrails in code first, then a gateway when the attack surface and provider sprawl justify the extra layer. The gateway is not a replacement for guardrails; it is where the shared controls live so every app gets them for free.
Q: What is the right way to measure hallucination rate in production without human review on every response?
A: Use a faithfulness metric as a proxy. Have an LLM judge compare the generated answer against the retrieved context, scoring whether each claim is supported. Run it on a sampled subset rather than every request to control cost, and set an alert when the average faithfulness drops below a threshold you established as your baseline. Calibrate the judge against a human-annotated sample first. This catches the systemic drift in groundedness — the "model got worse this week" signal — without needing to eyeball every output.
Q: How often should my eval suite run, and where?
A: Run fast automated metrics on every commit in CI — that is your regression gate. Run the heavier LLM-as-a-judge evaluations on a scheduled cadence (nightly or per-release) because they cost tokens and take time. Keep human evaluation for release candidates and high-stakes changes. In addition, sample production traffic continuously and pipe new, labeled cases back into the suite. The cadence is less about a fixed schedule and more about rule: the eval suite should run at least as often as the code changes, plus continuously against live traffic to catch drift.
Q: I have a simple single-call chatbot, not an agent. Do I really need tracing?
A: You need less of it, but not zero. For a single-model chatbot without tools, full agent-span tracing is overkill. You still need structured logs of prompt and response, model version, latency, and cost — plus an eval loop. Add tracing when you introduce retrieval, multiple model calls, or tools, because that is when failures start to originate in orchestration rather than the model itself. Match the observability depth to the system's complexity; over-instrumenting a trivial pipeline wastes engineering time.