Test-Time Compute Scaling: What the 2026 Benchmarks Actually Show
What 2026 benchmarks actually show about test-time compute scaling: efficiency curves, verifier bottlenecks, and where accuracy gains flatten.
Test-Time Compute Scaling in 2026: The State of Play
For most of the last decade, the reliable way to make a model better was to train a bigger one. That assumption is now under pressure. In 2026, the most consequential performance lever for many production workloads is not the size of the model but how much compute you spend at inference time — generating longer reasoning traces, sampling multiple candidates, searching over partial solutions, and verifying before answering.
This shift matters to anyone specifying, buying, or operating LLM systems. Test-time compute is not free. It trades latency and dollars for accuracy, and the trade is only worth making when the curve is still steep. The job of this article is to separate what the 2026 benchmark literature actually demonstrates from what vendors imply and pundits extrapolate. The headline is simple: the peaks are real but narrow, and the interesting engineering story lives in the curves.
Why Test-Time Compute Scaling Became the Default Lever
The underlying idea is a compute trade. Instead of paying once, up front, to train a larger model, you pay per query to let a smaller or mid-sized model think longer — emit more reasoning tokens, explore more candidate answers, or run a search over solution steps. Early results on math and code suggested this could substitute for a meaningful chunk of training scale on some task classes.
2026 is the inflection point because two things happened at once. First, reasoning-capable models moved from demos into production, so teams now have real inference bills and real latency SLOs attached to extended thinking (see our guide to [LLM inference cost management]). Second, benchmark suites began reporting compute-normalized results — accuracy as a function of token budget rather than a single peak number. That second change is the more important one. Once you plot accuracy against tokens spent, the shape of the returns becomes visible, and the shape is not a straight line.
The practical consequence: teams that treat "more reasoning tokens" as a dial to crank are overpaying. Teams that understand where their workload sits on the efficiency curve are getting most of the accuracy at a fraction of the cost.
The 2026 Benchmark Landscape
What the Headline Numbers Measure
The benchmark families that dominate 2026 reporting cluster into three groups: competition math and formal reasoning, code generation and repair, and multi-step agentic task completion. Each publishes results under several protocols that are easy to conflate:
- Single-attempt (pass@1): one sample, one answer. The closest proxy to a normal user request.
- pass@k: at least one of k samples is correct. Generous and increasingly unrealistic as k grows.
- Majority vote / self-consistency: sample many, return the modal answer. Requires no trained verifier but assumes the correct answer is the most common one.
- Verifier-selected: sample many, score with a learned or symbolic verifier, return the top pick. The most promising and the most dependent on verifier quality.
Most of the eye-catching gains in 2026 papers come from the last two protocols, and both assume sampling budgets far larger than a typical production request can afford. A result reported at 64 samples per query is not the same product as a single-pass system, even when the accuracy gap looks like a model upgrade.
Where the Benchmark Numbers Stop Being Comparable
Cross-paper comparisons are frequently apples-to-oranges, and the problem has gotten worse as the field has grown. Four variables routinely differ and rarely get normalized:
- Token budgets. One paper's "extended thinking" is 4K reasoning tokens; another's is 64K. Accuracy at 64K says little about accuracy at 4K.
- Verifier quality. A strong symbolic checker on math flatters the whole pipeline. Swap in a weak learned verifier and the same sampling budget underperforms.
- Prompt scaffolding. System prompts, tool access, and decomposition strategies move results by points that get attributed to "reasoning."
- Contamination controls. With reasoning benchmarks saturating, contamination checks are the difference between a real result and a memorized one.
A benchmark number without its token budget, sampling protocol, and verifier specification is not a reproducible result. Treat it as a claim about a pipeline, not a model.
Until you can see those four parameters, assume the headline figure describes the vendor's best-case configuration rather than a deployable system (see [how to evaluate LLM benchmarks for procurement]).
Diminishing Returns: The 2026 Efficiency Curves
Accuracy per Marginal Token
The consistent finding across 2026 evaluations is that accuracy gains from additional inference compute are approximately linear in the logarithm of compute over the mid-range, then flatten into a saturating regime at high budgets. In plain terms: each doubling of tokens buys a roughly constant increment of accuracy — until it doesn't, and the curve goes flat while cost keeps climbing. That log relationship is why the last few accuracy points are so expensive: getting from 80% to 90% can cost several times what 60% to 80% cost, and 90% to 95% can cost more again.
Where the curve bends depends heavily on task class:
- Competition math and formal proof: the knee sits relatively late. These tasks reward long, verifiable chains, and scaling can still pay well into the thousands of reasoning tokens.
- Open-ended reasoning and analysis: the knee arrives early. Beyond a modest budget, extra tokens produce more prose, not more correctness, and can introduce new errors.
- Agentic and multi-turn tasks: the curve is the flattest of the three. Errors compound across steps, so more thinking per step does less than better tool use or tighter step-level verification (see our guide to [agentic workflow design]).
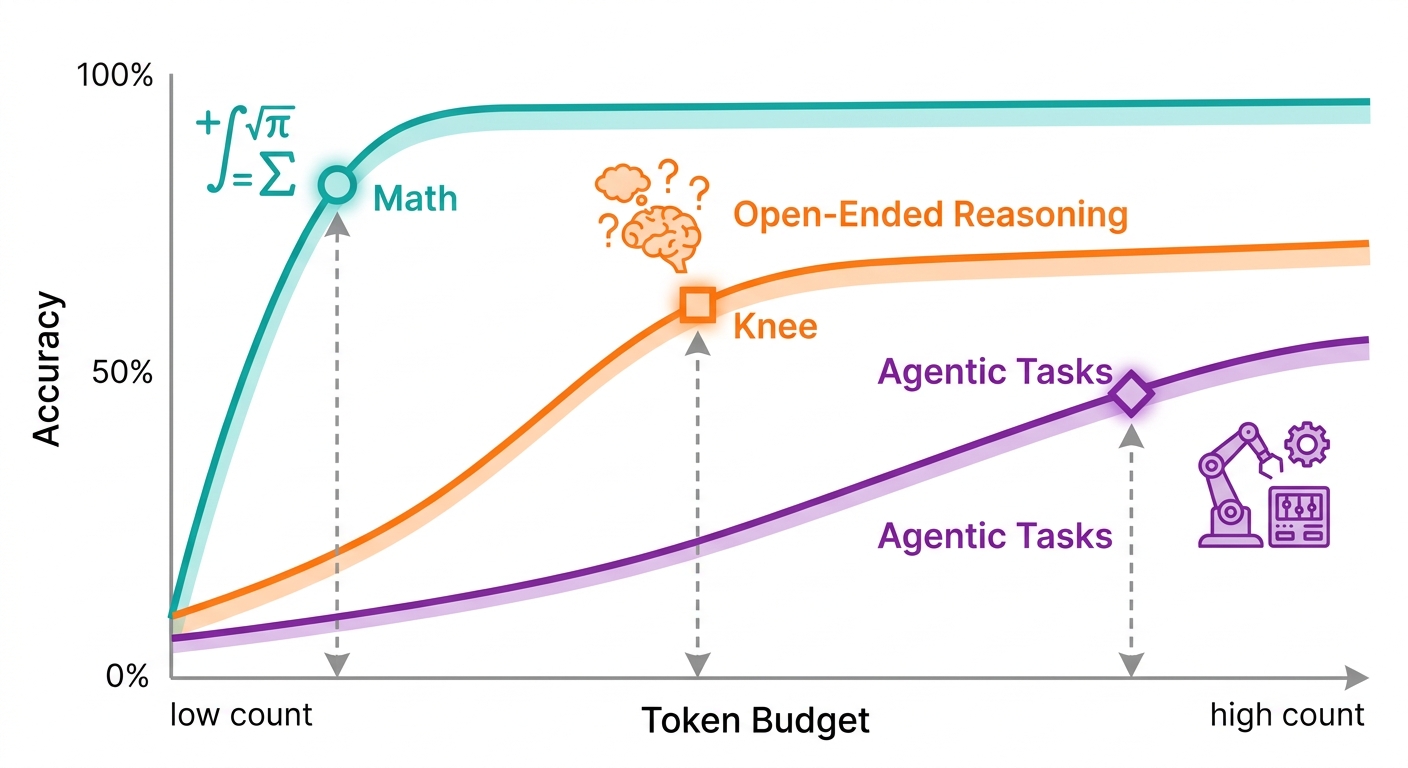
The engineering takeaway is that the knee, not the peak, is the operating point. Most of the achievable accuracy is captured well before the curve goes flat, and the last few points are where cost explodes.
The Verifier Bottleneck
Sampling only helps if something can pick the right answer out of the pile. That is the verifier's job, and in 2026 the verifier — not the generator — is usually the binding constraint on test-time scaling.
Three failure modes dominate:
- The verifier ceiling. A verifier that is only, say, 85% accurate at ranking candidates caps the whole pipeline near 85% no matter how many samples you draw. Past a point, additional sampling adds more near-miss candidates than the verifier can discriminate. The generator's coverage stops being the limit; the judge becomes it.
- Reward hacking and distribution shift. Learned verifiers are trained on a distribution of candidate answers. Sample long enough and the generator starts producing outputs that exploit verifier weaknesses rather than genuinely correct answers — confident, well-formatted, wrong. This is the test-time analogue of reward hacking, and it shows up as accuracy that degrades with more samples under a weak learned verifier.
- The verifier's own cost. A learned verifier run over k candidates is itself k forward passes (or more, if it is a larger model). Symbolic verifiers are cheaper and more reliable but only exist for domains with checkable structure — math, code that compiles and passes tests, formal proofs. For open-ended analysis there is often no trustworthy cheap verifier at all, which is precisely why those workloads hit the knee early.
The practical rule: budget the verifier inside the test-time compute budget, and gate scaling on verifier quality first. If you cannot specify how the winner is selected and how accurate that selection is, you do not have a scaling strategy — you have a sampling strategy with an unknown error rate.
Compute-Optimal Allocation: Smaller Model + More Samples, or Bigger Model + Fewer?
The most decision-relevant 2026 finding is not that returns diminish — it is how to split a fixed compute budget between model size and test-time samples. The consistent result across task classes is that for a fixed total inference budget, a smaller model given more samples frequently matches or beats a larger model given fewer, but only when a competent verifier (or a reliable majority-vote signal) is available to select among candidates. Where selection is weak, the advantage shrinks or reverses, because the larger single-pass model's better first answer is worth more than a pile of candidates you cannot rank.
That gives three regimes worth distinguishing in procurement:
- Strong verifier available (math, code, anything with a checker): lean toward smaller models with larger sample budgets; the selection step does the heavy lifting.
- Reliable majority-vote signal (answers that converge): moderate sampling helps; watch for questions where the model is confidently and consistently wrong.
- No trustworthy selector (open-ended analysis, judgment calls): spend the budget on a stronger model and tighter prompting, not on more samples.
Latency Is the Constraint Nobody Normalizes
Cost is only half the trade. The two levers move latency very differently:
- Sequential reasoning (longer traces) adds wall-clock time roughly in proportion to tokens generated. It is bounded by your SLO directly, and most production SLOs cap the usable sequential budget well below benchmark "extended thinking" settings.
- Parallel sampling (many candidates) trades dollars and compute for wall-clock: k samples run concurrently, and total latency is roughly the slowest sample plus verifier and aggregation time. This is the lever that fits a fixed latency budget, at the cost of k-fold compute.
The implication for anyone reading a benchmark: a result achieved through parallel sampling at k = 64 is a throughput and cost claim, not a latency claim. A result achieved through a 64K-token single trace is a latency claim. Conflating them is how teams end up with a system that is accurate on the eval and unusable under load.
Putting It to Work
The 2026 evidence supports a disciplined, curve-aware approach rather than a single dial. A procurement and design checklist that follows from the above:
- Demand the four parameters. For any claimed result, require token budget, sampling protocol, verifier specification, and contamination controls. No parameters, no comparison.
- Locate your knee empirically. Run your own workload across a ladder of token budgets and sample counts. Find where marginal accuracy per dollar falls below your threshold, and operate there.
- Specify the selector before scaling samples. Know exactly how the winning candidate is chosen and how accurate that selection is. If you can't, don't scale samples.
- Match the lever to the SLO. Use parallel sampling when latency is fixed and budget is flexible; use sequential reasoning only within the wall-clock headroom you actually have.
- Re-baseline when the model changes. Knees move between model versions and task distributions. A budget tuned last quarter is a guess this quarter.
The peaks in the 2026 benchmarks are real. But the peaks are narrow, they are usually reached under sampling and verification budgets most production systems cannot afford, and they say little about the operating point you should actually choose. The teams getting the most out of test-time compute are not the ones spending the most tokens — they are the ones who know exactly where their curve bends and stop there.