The Reasoning Benchmark Plateau: Why Frontier Models Stopped Winning on Math
Frontier models are converging on math benchmarks. Learn why the plateau is a benchmark-design problem—not a capability ceiling—and how to evaluate LLMs.
The leaderboard used to tell a story. Every few months, a new frontier model would post a large jump on a math or reasoning suite, and the press release would write itself. That story has stalled. Across the established reasoning benchmarks, the gaps between top models have compressed to the point where "new state of the art" often means a fraction of a percentage point—frequently smaller than the run-to-run variance of a single evaluation.
For practitioners, this is not an academic curiosity. If the headline numbers stop discriminating between models, the procurement and validation workflow that many teams built around them starts to wobble. Which model do you standardize on? How do you justify a migration? What does "better at reasoning" even mean when everyone posts a 90-something?
The thesis of this piece is that the plateau is primarily a benchmark-design problem, not a capability ceiling—with one honest caveat up front: a plateau in scores and a plateau in capability are observationally confounded. You cannot tell them apart from the leaderboard alone. That is precisely the problem. Math benchmarks have been optimized against for years, and they now tell us more about the benchmarks than about the models. Understanding why changes how your team should run LLM evaluation—and how you should read the next "SOTA" announcement. (See also: How to Evaluate LLMs Beyond Benchmark Scores)
The Reasoning Benchmark Plateau, Quantified
What the Numbers Show
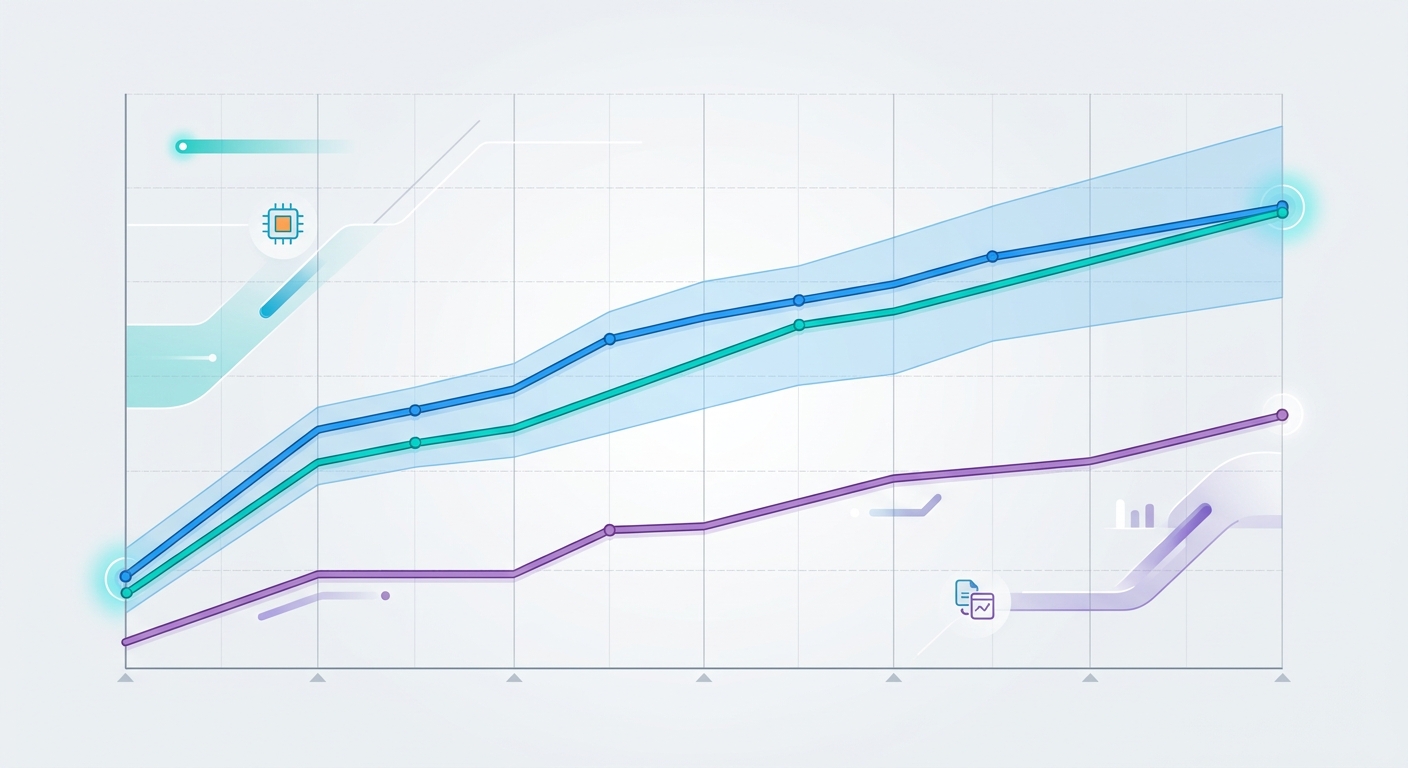
Start with the shape of the data. On the long-running math and reasoning suites, the distance between the top handful of models has been shrinking release over release. Where early generations separated cleanly—one model clearly ahead, others clearly behind—recent generations cluster. The top of the leaderboard is now a knot of near-ties.
This is margin compression, and it has a mechanical consequence: when the spread between models is smaller than the statistical uncertainty on a single benchmark run, ranking them is mostly noise. A model that "wins" by 0.8 points on a suite where the 95% confidence interval on the gap spans roughly ±1.5–2 points has not demonstrated superiority. It has landed on the favorable side of sampling variance.
The mechanism matters. On a benchmark of a few hundred items, each item is worth a large fraction of a point, and correctness on individual items is sensitive to prompt format, few-shot exemplar choice, answer ordering, and decoding settings. Small suites amplify this: a handful of flipped items moves the headline number more than most real capability differences between adjacent model generations. The headline rarely reflects this. "New SOTA on reasoning benchmark" reads as a capability claim; it is often a rounding artifact. (Related: Why Benchmark Confidence Intervals Matter in Model Selection)
To make this concrete: a 500-item suite gives each question a weight of 0.2 percentage points. Flip five borderline items—well within the noise band of temperature and exemplar choice—and the score moves a full point. On GSM8K, which contains roughly 1,319 test items and where the top cohort sits in the mid-to-high 90s, the surviving errors are concentrated in a small, idiosyncratic tail of ambiguous wordings and unusual arithmetic. Two models that disagree on 30 of those items are not meaningfully different reasoners; they are different coin-flippers on the same edge cases. The same dynamic now shows up on harder suites: as MATH and its successors approach similar saturation at the top of the leaderboard, the discriminating signal migrates from "can it solve the problem" to "does it format the final answer the way the grader expects," which is a parser question, not a reasoning question. A model that emits \boxed{\frac{1}{2}} and one that emits 0.5 can score a point apart on identical underlying work.
Saturation vs. Diminishing Returns
There are two distinct phenomena at play, and conflating them leads to bad conclusions.
Saturation is what happens when scores approach the ceiling. Once models are in the high 80s and 90s, the remaining headroom is small, and each additional point is harder to earn and easier to lose to noise. The benchmark has stopped being a discriminating instrument and become a pass/fail gate.
Diminishing returns is different: it describes genuinely slower progress on the underlying capability. The two can look identical on a chart.
The critical distinction is between a plateau in scores and a plateau in capability. A saturated benchmark tells you the test is easy for the current cohort. It does not tell you the models have stopped improving—only that this particular ruler can no longer measure the improvement. The capability may be advancing along axes the benchmark never probed: longer horizons, messier inputs, tool use, self-correction, cost efficiency. (See also: Measuring AI Capabilities That Benchmarks Miss)
A useful diagnostic separates the two. If a benchmark is saturated, a harder variant drawn from the same distribution should restore separation: take the items that every top model solves and replace them with problems one or two reasoning steps longer. If scores spread again, you were measuring a ceiling, not a wall. If the new suite also compresses immediately, you are closer to a genuine capability plateau on that axis. In practice, most of what the leaderboard shows is the first pattern—the ceiling—because the suites in question were designed years ago against a much weaker cohort and have never been re-normed.
Why Math Benchmarks Stopped Discriminating
Contamination and Memorization Pressure
The first cause is the oldest problem in evaluation: leakage. Math benchmarks are static, public, and widely mirrored. Once a benchmark is published, its problems enter the training-data ecosystem—through scraped corpora, through derived datasets, through solution write-ups that quote the problems verbatim.
A benchmark that has been in the wild for years is no longer a clean test of reasoning; it is partly a test of recall. Models can pattern-match to known problems and their known answers. This doesn't require deliberate gaming—it happens through ordinary data collection at scale. It is also model- and benchmark-specific: some vendors decontaminate against public sets or hold out evaluation data, so the effect is uneven rather than universal. But where it is present, contamination doesn't just raise scores; it compresses them toward the top, because the models that memorized best look most similar, and it erodes the benchmark's ability to separate models on the thing it claims to measure. The practical check is mechanical: n-gram overlap between benchmark items and training corpora, canary-string detection, and perturbation tests that reword problems while preserving the underlying reasoning. (Related: Detecting Benchmark Contamination in Training Data)
The failure mode to watch for is subtle. A contaminated model doesn't necessarily produce the memorized answer verbatim; it produces a plausible chain of reasoning that arrives at the memorized answer, which is harder to detect by inspection and inflates scores on exactly the items that should be hardest. The perturbation test catches this: rename the variables, change the numbers, keep the structure. If accuracy drops sharply on structurally identical problems, the original score was partly recall. A well-run eval keeps a rotating private set precisely so that this test can be run on demand rather than reconstructed after the fact.
The Chain-of-Thought Advantage Has Normalized
When chain-of-thought prompting first demonstrated large gains on multi-step math, it was a differentiator. A team that elicited reasoning steps got materially better answers than one that didn't.
That advantage has been absorbed—and the mechanism is deeper than "everyone prompts the same way." Frontier models are now trained to reason: long chain-of-thought post-training and reinforcement learning on verifiable rewards have moved step-by-step reasoning from a prompt-time trick into the model's default behavior. Structured reasoning is now table stakes, not a competitive edge. When every model does the thing that used to separate the leaders, the separation disappears.
The same normalization has happened to the surrounding scaffolding—self-consistency, answer verification, retry loops. These were once distinguishing engineering choices. Now they are standard components, and their gains are baked into every vendor's numbers. (See also: Chain-of-Thought Prompting: From Novelty to Baseline)
There is a second-order effect worth naming. Once reasoning is trained in rather than prompted, the prompt stops being a lever and the budget becomes one. The old advice—"add 'let's think step by step' and watch accuracy climb"—is now close to a no-op on a modern reasoning model. The new lever is how many tokens of thinking you allow before the answer is committed. That shifts the locus of differentiation from prompt engineering to inference configuration, which is exactly why the leaderboard numbers no longer map cleanly onto model quality.
Test-Time Compute Blurs the Model/System Line
The third cause is structural. With inference-time scaling, "the model" is no longer a single artifact. It is a system: a base model, a reasoning budget, a sampling strategy, possibly a verifier and a search procedure. Two deployments of the same weights can post very different benchmark scores depending on how much compute they spend per query.
This makes single-number comparisons misleading. A benchmark score now encodes a compute budget as much as a model. A 92 reported at 64 samples per query with a verifier is not comparable to a 90 reported at a single greedy sample. When vendors report their best configuration and competitors report theirs, the leaderboard is comparing systems, not weights—and the ranking can flip under a fixed, equal budget.
For procurement, the implication is concrete: never compare scores across different inference budgets, and never treat a vendor's headline as the number you will see in production. Ask what configuration produced the score, then re-measure at your own latency and cost constraints.
The trade-off is not hypothetical. Majority voting over 64 samples can recover several points on a hard suite, but it multiplies inference cost by roughly the sample count before you account for the verifier, and it adds tail latency that many interactive products cannot absorb. A model that needs 32 samples to hit 91 is frequently a worse production choice than one that hits 89 at a single pass, because the second one has a predictable cost and latency profile and the first does not. The number that should drive the decision is accuracy at your budget, measured on your traffic—not the vendor's best-of-N headline.
What This Means for Your Evaluation Workflow
The diagnosis is only useful if it changes practice. Four operating rules follow from the above:
-
Evaluate on data the model has not seen. Maintain a small, private, held-out set of task-grounded problems that never appear in public. Even a few hundred well-constructed items beat a saturated public suite for discrimination.
-
Report uncertainty, not just point estimates. Publish confidence intervals on every comparison, and refuse to call a winner when intervals overlap. Bootstrap over items is sufficient.
-
Fix the compute budget before comparing. Hold samples-per-query, decoding settings, and tool access constant across models, and report the budget alongside the score.
-
Track cost per correct answer, not accuracy alone. A model that is one point more accurate at three times the inference cost is usually the wrong procurement decision. The metric that survives saturation is the one that includes the denominator.
A fifth, quieter rule sits underneath the other four: re-norm your private set on a schedule. A held-out set that never rotates becomes a public benchmark in miniature—eventually it leaks, eventually it saturates, and eventually your team optimizes against it the same way the vendors optimized against the public suites. Rotating a fraction of the items each quarter, and retiring items once every model solves them, keeps the instrument sharp. The plateau is real, but it is the plateau of the ruler, not necessarily of the capability. Teams that keep reading the leaderboard as a capability ranking will keep making decisions on rounding artifacts—and will keep being surprised when the model that "won" the benchmark behaves indistinguishably from its rivals in production.