Where the Agent Money Went: AI Startup Funding in 2026
AI agent funding hit $41–46B in 2026 as capital shifted to infrastructure and vertical agents with proven deployments. See the full money map by tier and valuation.
AI Agent Funding Grew Up in 2026
2026 was the year AI agent funding stopped being a vibe and started being a spreadsheet. After two years of frothy rounds built on demo reels and waitlist screenshots, capital allocators imposed a new discipline: show production usage or show yourself out. The result was not a collapse but a reallocation — money kept flowing, but it flowed differently.
The thesis of this funding map is simple. Capital moved decisively toward infrastructure and vertical agents with proven deployments, and away from thin-wrapper startups that reskinned a foundation model and called it a company. The directional signal was clear: aggregate dollars held roughly flat to modestly up year over year, while disclosed deal counts fell sharply. Fewer, larger, more scrutinized checks.
What follows is a breakdown of where AI agent funding landed in 2026 — by category, by tier, by valuation logic — and what that geography means for the engineering leaders who will eventually buy from these companies. (See also: How to evaluate an AI agent vendor before you sign.)
The 2026 Headline: AI Agent Funding by the Numbers
A note on the numbers. The figures in this section are estimates assembled from public reporting and directional reads on PitchBook, Crunchbase, and CB Insights coverage. They are not a single verified dataset. Definitions of "agent startup" vary across providers, many rounds are undisclosed, and corporate strategic investments are inconsistently captured. Treat the pattern as the reliable signal and the precise figures as approximate.
On that basis, agent-focused startups were on pace to raise in the low-to-mid tens of billions of dollars across roughly 1,000–1,200 disclosed deals in 2026 — against a 2025 baseline of a similar or slightly lower dollar total spread across well over 1,800 deals. The shape matters more than the decimal: dollar volume held or grew while disclosed deal count fell by roughly 40% or more.
The average round size tells the story. Median seed checks for agent startups dipped slightly as seed investors got pickier, but Series B and C rounds ballooned, with a handful of $500M+ mega-rounds in orchestration and vertical platforms pulling the aggregate upward. The market consolidated around fewer, more credible companies.
A terminology note before we go further: this map treats "agent startups" as companies selling agent capabilities (vertical and horizontal agents) and the tooling to run them safely (orchestration, evals, observability, guardrails). Those are different businesses with different economics, and lumping them is exactly why headline funding totals are so slippery. (Related: AI funding trends: 2025 in review.)
Where AI Agent Capital Concentrated
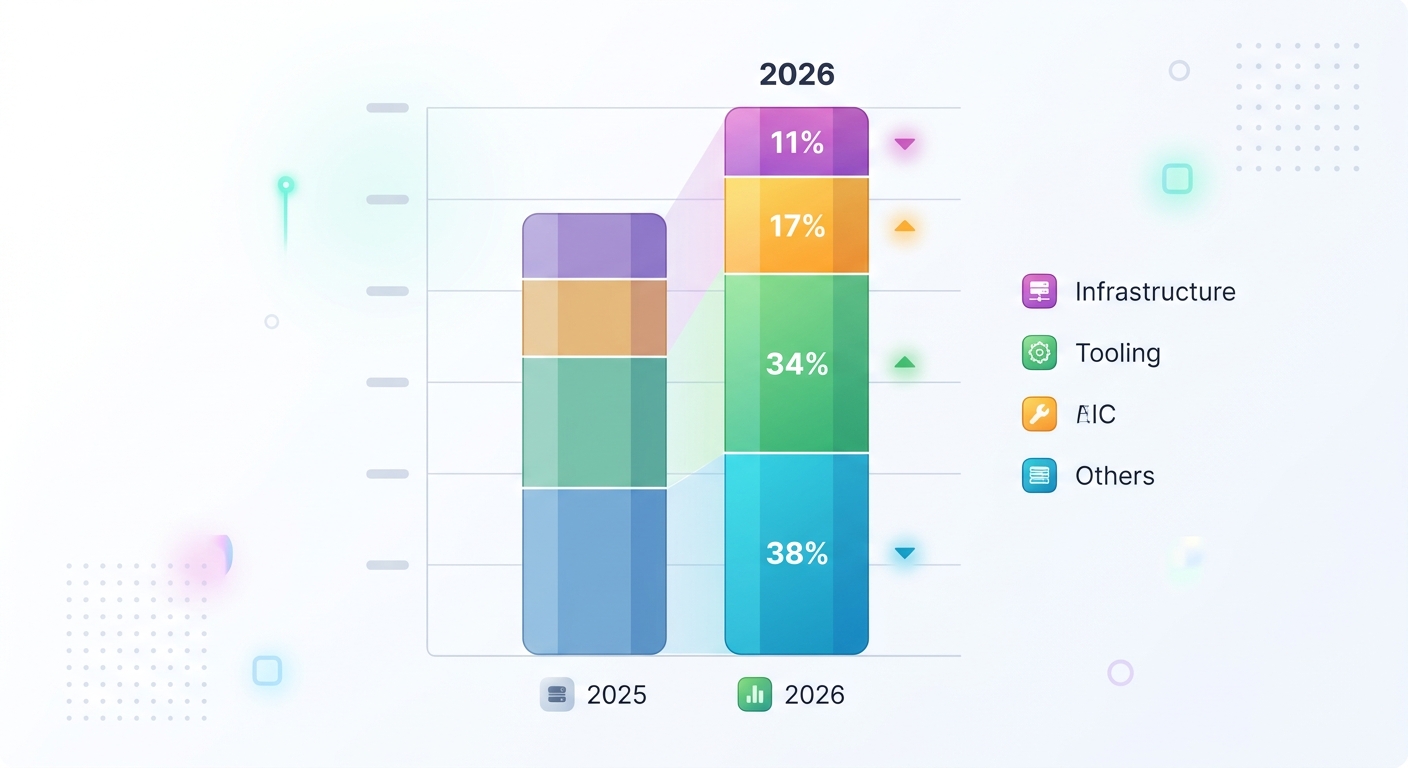
By category, our read of the 2026 split looked roughly like this — directional estimates, not measured shares:
- Infrastructure and orchestration: ~38% of dollars
- Vertical agents (finance, legal, healthcare, devtools): ~34% of dollars
- Tooling, eval, and observability: ~17% of dollars
- Consumer and horizontal assistants: ~11% of dollars
These buckets overlap. Eval and observability tooling is arguably a subset of infrastructure, and "horizontal assistants" is a fuzzy category that catches everything from coding copilots to general-purpose chat products. The takeaway is the ordering, not the exact percentages: infrastructure and vertical agents together took the clear majority of capital.
Geographically, US-headquartered startups captured the large majority of agent funding — on the order of 70% — with the EU (particularly the UK, France, and Germany) and Israel splitting most of the remainder. The US share appears to have slipped modestly from 2025, a pattern consistent with the rise of European sovereign-tech funds and Israel's deep infrastructure talent pool, though the causal link is our read rather than a measured finding.
The Three Tiers of AI Agent Startups That Got Funded
To make sense of the money map, it helps to sort the funded universe into three tiers defined by what the company sells and how provable its production footprint is.
- Tier 1 — Infrastructure and orchestration: the picks-and-shovels layer that other companies build agents on.
- Tier 2 — Vertical agents: domain-specific agents with proprietary workflow data and measurable enterprise ROI.
- Tier 3 — Consolidation casualties: thin-wrapper startups that raised early, failed to prove deployment, and got absorbed, down-rounded, or shut down.
Tier 1 — Infrastructure and Orchestration
This tier took the largest single share of capital. Orchestration frameworks, agent observability, evaluation and testing harnesses, memory layers, and guardrail/security tooling all attracted serious checks. Investors gravitated here for a familiar reason: selling tools to everyone beats betting on one winner.
The logic is durable. Every enterprise building agents needs tracing, evals, cost controls, and safety rails regardless of which vertical wins. Infrastructure companies also tended to show more predictable expansion than application-layer startups — a pattern investors rewarded in a disciplined market, though it is a generalization and not true of every company in the tier. (Deeper dive: Agent observability and eval tooling explained.)
Tier 2 — Vertical Agents
Vertical agents in finance, legal, healthcare, devtools, and customer operations raised the second-largest pool. The common thread among the winners was proprietary workflow data plus a number a CFO could defend — hours saved, tickets deflected, contracts reviewed per analyst.
The companies that got funded here were not selling "an AI agent." They were selling a measurable outcome inside a specific workflow, often with deep integrations into systems of record. That specificity is what separated them from the horizontal-assistant crowd. (Related: Vertical AI agents: the enterprise ROI playbook.)
Tier 3 — The Consolidation Casualties
The casualty tier is where the story gets sobering. Startups that raised in 2024 on demo momentum but never crossed into production found 2026's market unforgiving. The outcomes clustered into three distinct shapes worth separating: down rounds (existing investors marking down and re-upping at a lower price), acqui-hires (talent absorbed, product wound down), and quiet shutdowns (no announcement, just a lapsed domain and a dead changelog). All three concentrated among thin-wrapper companies with no proprietary data and no defensible integration moat.
What separated survivors from casualties came down to three things: real production usage, a data or workflow advantage competitors couldn't replicate quickly, and enough runway to survive a longer sales cycle. Companies missing any one of those three struggled to raise. (Read more: Why thin-wrapper AI startups fail to scale.)
AI Agent Valuations: What Buyers Are Actually Paying For
Agent startups are still priced at a premium to traditional SaaS, but the premium narrowed in 2026 and the basis for it changed. The market stopped paying for narrative multiples and started paying for quality-of-revenue multiples. In practice, that means investors underwrote on a handful of metrics that map directly to what an enterprise buyer should also care about:
- Net revenue retention (NRR). The single most-watched number. Infrastructure and sticky vertical agents with NRR above ~120% commanded premium multiples; sub-100% NRR was a red flag that triggered down rounds regardless of top-line growth.
- Gross margin. Agent companies carry real inference and orchestration costs. Companies reporting gross margins in the 50–65% range (below classic SaaS's 75%+) were valued accordingly, and investors pushed hard on the path to margin expansion as models got cheaper and caching/prompt-efficiency improved.
- Burn multiple. Net burn divided by net new ARR. In a disciplined market, a burn multiple above ~2x invited scrutiny and above ~3x invited a hard conversation. Capital efficiency became a selling point again.
- Production deployment evidence. Logo counts gave way to deployed seat counts, workflow penetration, and expansion within accounts. A handful of pilot logos no longer justified a premium.
The practical consequence: valuation dispersion widened dramatically. The best infrastructure and vertical companies raised at flat-to-up multiples on strong metrics, while the long tail of application-layer startups faced flat or down rounds. The median masked a barbell — a cluster of well-capitalized winners and a large population of companies that raised small early checks and never raised again.
What This Means for Engineering Leaders Buying Agents
The funding map is not just investor trivia. It is a leading indicator of vendor durability, and engineering leaders evaluating agent vendors should read it the same way a credit analyst reads a balance sheet. Three practical implications:
- Ask about runway and last round, tactfully but directly. A vendor that raised a large Series B in 2026 has room to survive a long enterprise sales cycle; one that raised a seed in 2024 and hasn't announced since may not. Ask when the last round closed and how the company thinks about runway. A confident answer is itself a signal.
- Price in consolidation risk for thin integrations. If a vendor's value is mostly a wrapper around a foundation model with shallow integration into your systems of record, assume it is an acquisition or shutdown candidate. Prefer vendors whose moat is workflow depth and data you'd have to rebuild to replace.
- Treat infrastructure lock-in as a first-class risk. Orchestration, memory, and observability layers are sticky by design. Before committing, confirm data portability, export paths, and whether the eval/tracing standards the vendor uses are open or proprietary. The companies that took the most capital are also the ones positioned to raise switching costs.
The 2026 lesson for buyers mirrors the one for investors: production evidence beats pitch decks on both sides of the table. The vendors worth your signature are the ones that can show you deployed workflows, defensible margins, and a runway long enough to be your partner in two years — not just your demo today. (See also: How to evaluate an AI agent vendor before you sign.)