The Hidden Cost of MLOps: Why 70% of Enterprise ML Projects Stall in Deployment
Meta description: Enterprise ML projects fail at deployment at a 70–90% rate. Here are the four root causes — data pipelines, manual deployments, infrastructure complexity, and organizational silos — and a practical MLOps maturity framework to close the gap.
The Hidden Cost of MLOps: Why 70% of Enterprise ML Projects Stall in Deployment
Enterprise machine learning has a deployment problem. While data science teams ship impressive pilot models, most never reach production. The ones that do often stall within months. The culprit is not poor algorithms — it is the operational gap between building an ML model and running one reliably at scale. This gap has a name: MLOps debt. It accumulates silently in broken data pipelines, manual deployment processes, and undefined ownership of production models. Understanding where it comes from is the first step toward closing it.
Key takeaways:
- 70–90% of enterprise ML projects fail to reach production or stall shortly after deployment
- The four root causes are data pipeline breakdowns, manual deployment tax, invisible infrastructure complexity, and organizational silos
- A four-level MLOps maturity framework provides a practical path from ad hoc to optimized
- Moving from Level 0 to Level 1 is the highest-leverage first step for most teams
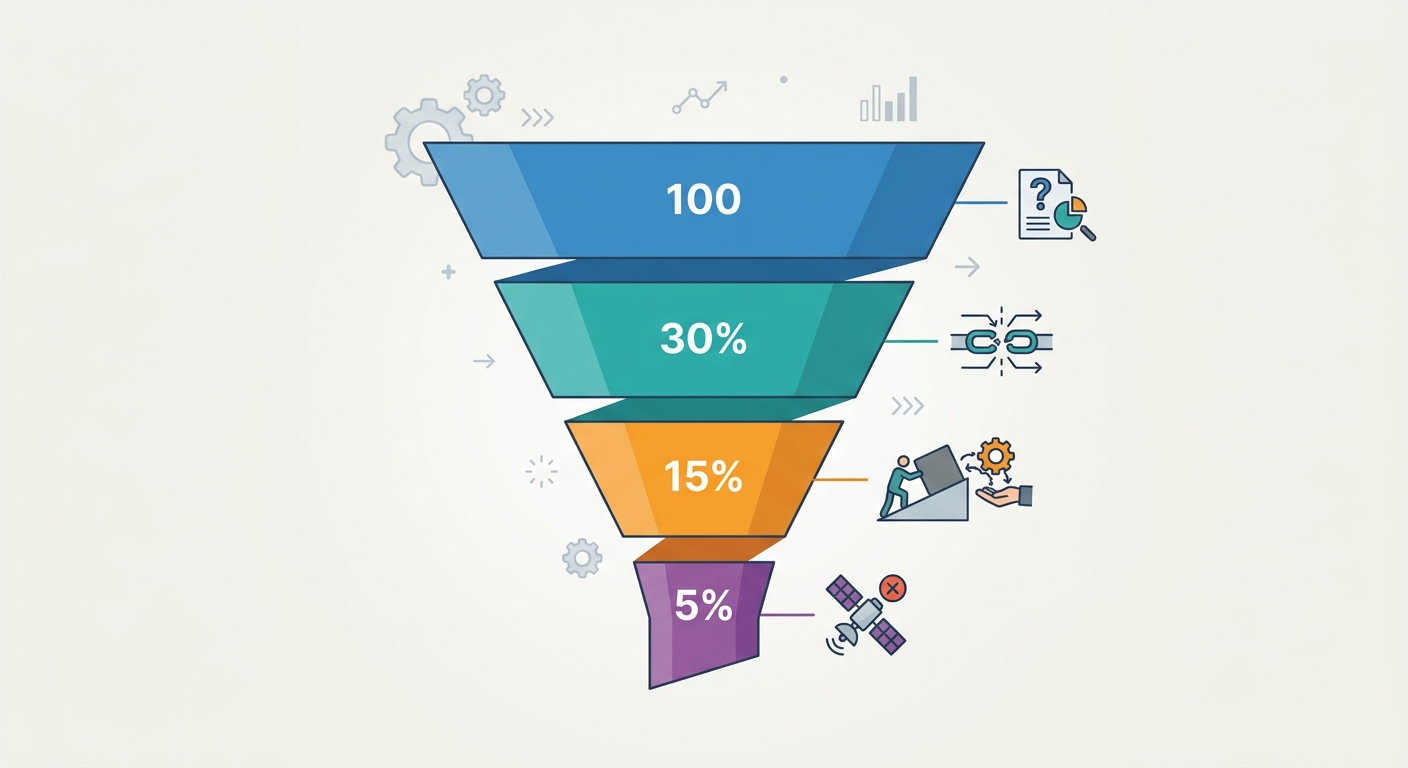
The Staggering Deployment Gap
The deployment gap is not a new problem. It has persisted for years despite massive investments in AI talent and infrastructure. The reason is structural: machine learning systems have a unique failure mode that traditional software engineering practices did not anticipate.
Traditional software fails loudly. A bug produces an error message, an exception, a crash. Machine learning systems fail silently. A model can degrade over weeks as underlying data distributions shift. Predictions drift from accuracy toward noise. The system continues to serve responses. No error is thrown. The degradation is invisible until it shows up in a business metric.
This silent failure pattern explains why 53% of organizations discover critical model issues more than three weeks after they occur. By the time the problem is visible, it has already compounded. A model that was 94% accurate at launch might be performing at 81% accuracy without anyone noticing.
The deployment gap also reflects a measurement problem. Data science teams are measured on offline metrics — AUC, precision, recall — computed on historical test sets. These metrics do not capture whether the serving infrastructure is stable, whether feature computations are consistent between training and inference, or whether the model is being updated faster than its environment is changing.
The consequence is that ML initiatives are funded based on pilot performance and killed based on production disappointment. The pipeline from pilot to production is where value goes to die.
Root Cause #1 — Data Pipeline Breakdowns
The most common reason an ML project dies in production is not model quality. It is data.
Train-serve skew is the phenomenon where features computed during training differ from features computed at inference time. A model trained on historical customer data might use a feature derived from a 30-day rolling window. At serving time, the same computation runs differently because the underlying data warehouse updated its schema or a join operation changed. The model silently degrades. Predictions drift. No error is thrown.
This happens because ML teams typically maintain two code paths for feature computation. The training pipeline reads historical data and computes features. The serving system reads live data and computes features. These two paths diverge over time as engineers make changes that are not synchronized. The model does not know it is computing on different data. It simply produces worse predictions.
Research shows that 73% of ML failures trace back to undocumented changes in production data schemas. A column gets renamed. A default value changes. An upstream system starts sending nulls where it previously sent zeros. The training pipeline silently adapts or breaks. The serving pipeline does something different. The model fails without an error.
Data versioning complexity affects 62% of enterprises as their primary ML pipeline bottleneck. Without versioned datasets tied to versioned model artifacts, there is no reliable way to reproduce a model or debug why its behavior changed. When a model performs differently today than it did six months ago, the question "what changed?" cannot be answered without disciplined data versioning.
The practical solution is a feature store — a centralized repository where features are defined, computed, and served consistently across both training and inference environments. When features are computed in one place and one way, train-serve skew disappears. When feature versions are tracked alongside model versions, debugging becomes tractable.
Teams that invest in a feature store upfront dramatically reduce their post-deployment incident rate. The feature store becomes the bridge that closes the gap between the data scientist's feature engineering work and the production system's feature serving requirements.
Root Cause #2 — The Manual Deployment Tax
Traditional software deployment has matured through decades of CI/CD tooling. ML deployment has not.
When a data scientist finishes a model in a Jupyter notebook, the path to production requires translating that notebook into a serving system. This means rewriting model code, setting up inference pipelines, configuring GPU scheduling, implementing health checks, and wiring monitoring. Each step is manual. Each step introduces error.
71% higher failure rate — Organizations lacking deployment automation experience a 71% higher failure rate in production compared to teams with automated pipelines. The reasons are predictable: manual processes accumulate technical debt, introduce inconsistent configurations, and create fragile infrastructure that breaks under load.
The notebook-to-production gap is particularly damaging. Notebooks are built for exploration. Production systems require reliability, reproducibility, and observability. A notebook that produces excellent offline metrics may hide dependencies, non-deterministic behavior, or hardcoded paths that make it impossible to reproduce in production.
Consider what a manual deployment actually requires. The data scientist exports a pickled model file. They hand it to an ML engineer with a Slack message. The ML engineer creates a Docker container, installs the right Python version and dependencies, configures a GPU instance, sets up an API endpoint, writes a health check, configures logging, and deploys. Three weeks later, the model is in production. During those three weeks, the data scientist has moved on to another project. The ML engineer has no context on the model's data requirements or expected behavior.
The fix is pipeline automation using tools like MLflow, Kubeflow, or managed platforms like Vertex AI and SageMaker. These systems codify the steps between model training and model serving. They make deployments repeatable, rollbacks possible, and the entire process observable. When a deployment fails, the system — not a person — has the context to understand why.
Automated pipelines also enable the retraining loop. Models degrade as environments change. An automated pipeline can detect this degradation and trigger a retraining run without human intervention. Manual pipelines cannot support this cycle because the human effort required is prohibitive.
Root Cause #3 — Invisible Infrastructure Complexity
ML workloads have infrastructure requirements that differ fundamentally from traditional software.
GPU resource management sits at the top of the list. Training jobs consume GPU resources intermittently and unpredictably. A team might need 40 GPUs for a large training run on Tuesday and zero on Wednesday. A serving system might need 8 GPUs during business hours and 2 during off-peak periods. Without intelligent GPU scheduling, organizations either over-provision — burning budget on idle resources — or under-provision — causing latency spikes and dropped requests when traffic arrives.
GPU allocation is also a blast radius problem. A single misconfigured training job can exhaust an entire GPU cluster, disrupting serving workloads that are simultaneously running. In traditional software infrastructure, a runaway process might degrade a single service. In ML infrastructure, a runaway training job can degrade an entire cluster.
Dynamic scaling failures are common because ML inference has unique load patterns that standard Kubernetes horizontal pod autoscaling cannot handle well. A recommendation model might see 10x traffic spikes during product launches. A fraud detection model might go quiet on holidays. A demand forecasting model might process nightly batch inference at midnight. Static infrastructure cannot handle this variability. Yet most ML serving systems are deployed with CPU and memory-based autoscaling metrics that do not capture the actual load on GPU resources.
The true cost of ML compute is frequently underestimated. Cloud GPU instances cost $2–10 per hour depending on the GPU type. A single large model training run can consume thousands of dollars in compute. Inference at scale multiplies this cost continuously. Without proper cost governance, ML infrastructure becomes a budget black hole that finance teams cannot understand and engineering teams cannot control.
The solution is observability-first infrastructure. GPU utilization, memory bandwidth, inference latency, and batch size per request should be tracked as first-class metrics. Cost attribution by team, model, and feature should be visible in real time. When a data scientist launches a training job, they should see its cost accumulate in real time, not discover the charge on a monthly bill.
Root Cause #4 — Organizational Silos
The most counterintuitive finding in ML operationalization research is that the biggest barriers are not technical.
Studies consistently show that 70% of production ML issues are organizational rather than technical. The root cause is silos: data scientists build models in isolation, ML engineers build infrastructure in isolation, and neither group owns the full production lifecycle.
This creates a classic gap at the handoff point. The data scientist owns the model through the pilot stage. The ML engineer owns the serving infrastructure. Production behavior — how the model performs under real traffic, whether its predictions are reasonable, when it needs retraining — is nobody's explicit responsibility.
When a model starts degrading at 2am, who gets paged? When a feature schema changes upstream, who validates the impact on existing models? When the business team asks why the fraud model is flagging more legitimate transactions, who investigates? Without clear answers, problems compound silently and teams blame each other publicly.
Silos also create knowledge traps. A data scientist might spend two weeks building a model, hit a deployment blocker, and move on to the next project. That blocker — a missing dependency, a GPU capacity issue, an API compatibility problem — never gets resolved. The next data scientist hits the same blocker. The organization never invests in fixing it.
The structural fix is to establish an ML platform team that owns the infrastructure and tooling used by data scientists. This team treats the ML platform as a product. It provides self-service tools for feature computation, model training, deployment, and monitoring. Data scientists remain responsible for model quality. Platform engineers remain responsible for infrastructure reliability. Clear ownership removes the gap where ML projects go to die.
Organizations that successfully operationalize ML treat it as a product, not a project. They establish ML platform teams that own the infrastructure, data science teams that own model quality, and MLOps practices that define the handoff between experimentation and production.
The MLOps Maturity Framework
Teams can assess their operationalization maturity using a practical four-level framework.
Level 0 — Ad Hoc is where most enterprises start. Models are trained in notebooks. Deployment is a custom script written by whoever built the model. Monitoring is manual or absent. This is the level where 70–90% of projects stall.
In an ad hoc environment, a new model deployment takes two to four weeks of manual effort. Rollback is not possible. When something breaks, debugging requires searching through Slack history and notebook commits. This is the dominant mode for organizations that are early in their ML journey.
Level 1 — Repeatable introduces basic automation. Training pipelines run on a schedule. Model artifacts are stored in a registry with version numbers. Deployment still requires manual steps, but the process is documented and somewhat reproducible.
At Level 1, a new model deployment takes three to five days. Rollback is possible by redeploying a previous model artifact. Monitoring dashboards exist, though they require manual setup for each new model.
Level 2 — Automated extends CI/CD practices to ML. Code, data, and model versions are tracked together in a unified system. A code commit can trigger a full retraining and evaluation pipeline. Deployment is automated through a staged rollout with canary testing and automated rollback.
At Level 2, a new model deployment takes hours, not days. The system handles rollbacks automatically. Model performance is monitored continuously and alerts fire when metrics degrade.
Level 3 — Optimized closes the loop with full observability and self-healing. Model performance is monitored in production with statistical drift detection. When drift is detected, automatic retraining is triggered. Cost governance is built in. The system adapts without human intervention.
Moving from Level 0 to Level 1 is the highest-leverage step for most organizations. It does not require a complete platform overhaul. It requires three things: agreeing on what a model artifact is, defining where it lives, and automating the path from trained artifact to deployed endpoint.
The transition from Level 1 to Level 2 requires investment in CI/CD for ML — tooling that can version data alongside code and models, trigger pipeline runs on schedule or on demand, and evaluate model quality automatically before deployment proceeds. Tools like MLflow, Kubeflow Pipelines, and SageMaker Pipelines provide this capability.
The transition from Level 2 to Level 3 requires investment in observability and automated decision-making. This is where the organization moves from "we can deploy quickly" to "our system deploys and heals itself."
Expert Q&A: MLOps Deployment Challenges
Q: The 70–90% failure rate for ML projects is widely cited. Is it actually that bad in practice, or is the number inflated by low-quality projects that should not have been started?
A: The number is real, but it needs context. The projects that fail are not trivial. Many are well-funded, well-staffed efforts at serious enterprises. The failure rate is high because the bar for production ML is genuinely hard — you need data infrastructure, deployment automation, monitoring, and organizational alignment simultaneously. Projects that fail often fail because they treat ML like a software project that happens to need a model. It is not. The operational requirements are different and most organizations are not set up to meet them.
Q: You mention train-serve skew as the primary reason ML projects fail. What does it actually look like when it happens?
A: A concrete example: a team builds a customer churn model. They compute a feature called "days_since_last_login" by querying an events table. The training pipeline runs a SQL query that gets the last 90 days of events. The serving system runs a query that gets the last 90 days of events. Six months later, the data warehouse team changes the events table schema — they add a filter that excludes events from internal test users. The training pipeline, which runs the query with the updated schema, gets different numbers. The serving system gets different numbers. The model was trained on data that no longer matches what it sees at inference. Predictions get worse. Nobody gets an error. It takes three weeks to realize what happened.
Q: What is the single highest-leverage investment a team at Level 0 (ad hoc) can make to improve their MLOps posture?
A: Implement a feature store. Not a full-featured enterprise feature store — even a simple one that enforces a single code path for feature computation, used by both training and serving, will eliminate the majority of train-serve skew issues. The second highest-leverage investment is moving from manual model file exports to a model registry with versioned artifacts. A model registry does not solve the deployment problem, but it creates the foundation for solving it. Once you know what a "model version" is and where it lives, you can start automating the path from trained artifact to deployed endpoint. Those two changes — feature store plus model registry — address the root causes behind the majority of stalled ML projects.
Conclusion
MLOps is not a luxury. It is the mechanism that determines whether an ML investment delivers value or becomes a silent failure buried in a quarterly review.
The hidden cost of poor MLOps is not just the compute budget wasted on failed experiments. It is the opportunity cost of models that were built but never served, the engineering hours spent firefighting manual deployment processes, and the business impact of ML initiatives that stall in pilot purgatory.
The path forward is not a multi-year platform rebuild. It is a sequence of targeted improvements: fix the data pipeline first by implementing a feature store, automate the deployment pipeline second by adopting CI/CD for ML, establish clear ownership third by defining who is responsible for production model behavior, and layer in observability as the system matures.
Start at Level 1. Ship one model to production with a proper feature store and a monitored pipeline. Document the process. Use that success to build the case for Level 2.
The cost of staying at Level 0 is hidden but real. It compounds every quarter. Every team that burns out on manual deployments, every model that silently degrades, every data scientist who moves to another company because they cannot get their models into production — these are the hidden costs of MLOps debt.
The investment to fix it is smaller than you think. The cost of not fixing it is larger than you know.
Expert Q&A: MLOps Deployment Challenges
Q: The 70–90% failure rate for ML projects is widely cited. Is it actually that bad in practice, or is the number inflated by low-quality projects that should not have been started?
A: The number is real, but it needs context. The projects that fail are not trivial. Many are well-funded, well-staffed efforts at serious enterprises. The failure rate is high because the bar for production ML is genuinely hard — you need data infrastructure, deployment automation, monitoring, and organizational alignment simultaneously. Projects that fail often fail because they treat ML like a software project that happens to need a model. It is not. The operational requirements are different and most organizations are not set up to meet them.
Q: You mention train-serve skew as the primary reason ML projects fail. What does it actually look like when it happens?
A: A concrete example: a team builds a customer churn model. They compute a feature called "days_since_last_login" by querying an events table. The training pipeline runs a SQL query that gets the last 90 days of events. The serving system runs a query that gets the last 90 days of events. Six months later, the data warehouse team changes the events table schema — they add a filter that excludes events from internal test users. The training pipeline, which runs the query with the updated schema, gets different numbers. The serving system gets different numbers. The model was trained on data that no longer matches what it sees at inference. Predictions get worse. Nobody gets an error. It takes three weeks to realize what happened.
Q: What is the single highest-leverage investment a team at Level 0 (ad hoc) can make to improve their MLOps posture?
A: Implement a feature store. Not a full-featured enterprise feature store — even a simple one that enforces a single code path for feature computation, used by both training and serving, will eliminate the majority of train-serve skew issues. The second highest-leverage investment is moving from manual model file exports to a model registry with versioned artifacts. A model registry does not solve the deployment problem, but it creates the foundation for solving it. Once you know what a "model version" is and where it lives, you can start automating the path from trained artifact to deployed endpoint. Those two changes — feature store plus model registry — address the root causes behind the majority of stalled ML projects.
**Internal linking suggestions:
- Link "feature store" to any existing feature store article
- Link "MLflow, Kubeflow" to any existing MLOps tools article
- Link "train-serve skew" to any existing data quality article
- Link "ML technical debt" to any existing technical debt article