ML Pipelines with Kubernetes and KServe: A Production-Ready Deployment Architecture
A practical guide to deploying ML models at scale with Kubernetes and KServe — covering InferenceService architecture, canary deployments, auto-scaling, and production monitoring patterns for 2026.
Introduction
Training a machine learning model is only half the battle. Getting it to serve predictions reliably, at scale, under variable load, while maintaining low latency and zero downtime during updates—that is the other half, and it is where many ML projects stall. The tooling has matured significantly, and in 2026 the de facto standard for self-hosted ML inference is Kubernetes combined with KServe, a model inference platform built specifically for Kubernetes.
KServe provides model inference on Kubernetes through a declarative API that abstracts away the complexity of pod management, model downloading, and request routing. This guide walks through the full architecture: what KServe is, how its components fit together, how to configure InferenceServices for different model types, how to run canary deployments, how to auto-scale based on real request volume, and how to monitor everything that matters in production.
What is KServe?
KServe originated as KFServing, a subproject of the Kubeflow machine learning platform. In 2021 it was donated to the Cloud Native Computing Foundation (CNCF) and rebranded as KServe, reflecting its maturation into a standalone, framework-agnostic model inference platform.
The core value proposition is simple: InferenceService CRD declares model deployment to Kubernetes with a single declarative configuration. Instead of writing a Kubernetes Deployment for your model server, managing pod lifecycle, configuring service networking, and implementing health checks manually, you define an InferenceService resource and KServe handles the rest. The platform understands model formats, knows how to download artifacts from cloud storage, and provides the admission webhooks that validate and configure your inference pods.
KServe supports a wide range of ML frameworks out of the box: TensorFlow SavedModel, PyTorch, XGBoost, LightGBM, scikit-learn, ONNX, and more through its pluggable model server architecture. If you need a framework KServe does not natively support, you can build a custom model server and serve it through KServe's infrastructure.
The platform also provides three extension points beyond simple prediction: Transformers for pre/post-processing, Explainers for model interpretability (SHAP, anchor explanations), and InferenceGraphs for multi-step inference pipelines. These let you build sophisticated inference workflows while keeping each component independently deployable and scalable.
Architecture Components
Understanding KServe means understanding its components and how they fit together in a running inference deployment.
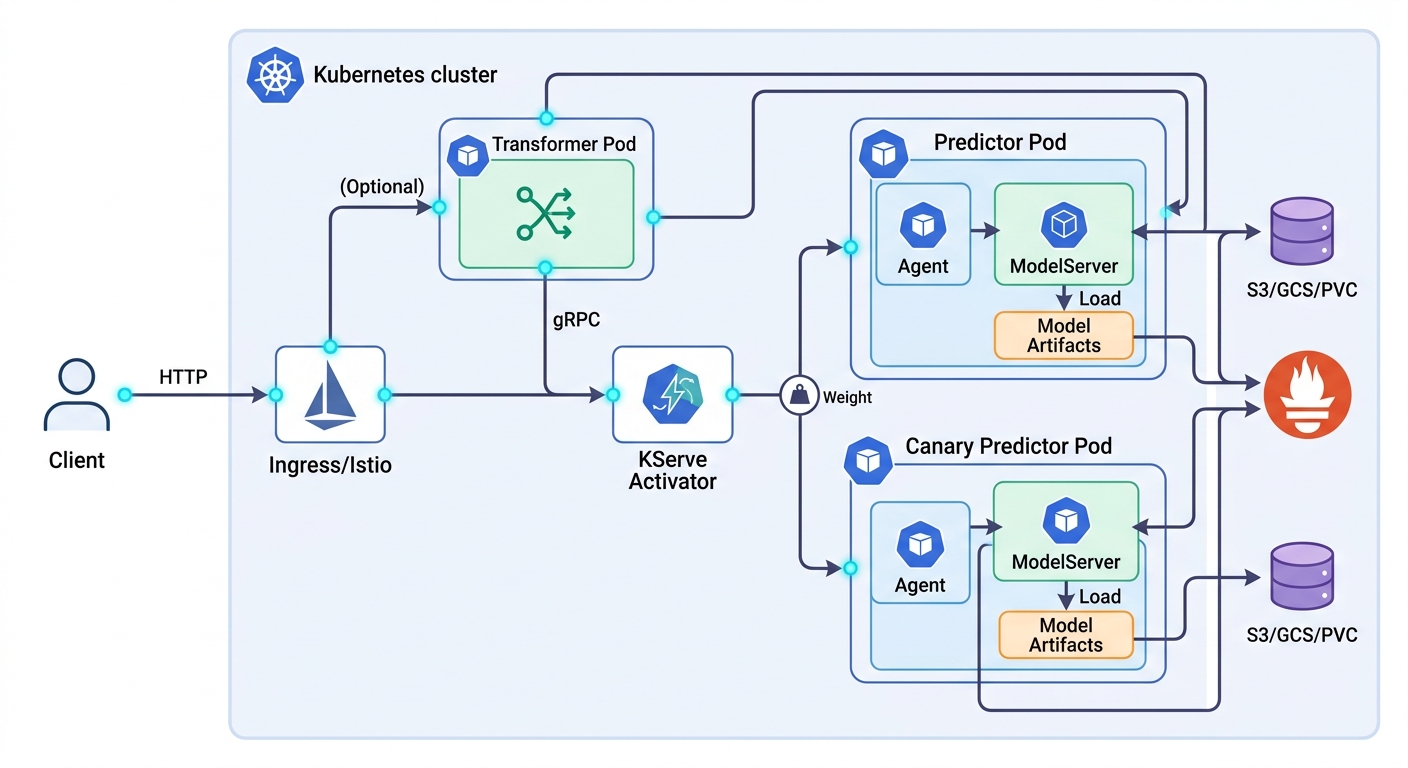
Predictor is the core component—the Kubernetes pod that actually runs your model and serves predictions. Within the predictor pod, a ModelServer process (TorchServe for PyTorch, TF Serving for TensorFlow, MLServer for sklearn/XGBoost, or Tritonserver for ONNX) loads your model artifacts and handles the inference loop. An Agent sidecar runs alongside the ModelServer, managing artifact downloading from remote storage, version tracking, and storage lifecycle.
Transformers are optional but commonly needed. A transformer is a separate service that runs before requests reach the predictor. It handles input decoding and preprocessing—JSON parsing, tokenization, image resizing, feature normalization. Transformer separates input preprocessing from model serving concerns, keeping your model server isolated from protocol concerns. This separation means you can update your preprocessing logic without rebuilding your model server image.
StorageConnector is the component that pulls model artifacts from wherever they live. KServe supports S3, GCS (Google Cloud Storage), Azure Blob, and PersistentVolumeClaims. At pod startup, the Agent downloads the model to a local volume before the ModelServer starts. For very large models (particularly GPU models), you can pre-stage artifacts on a PVC to avoid download delays at scale-out.
When you deploy an InferenceService, the key spec fields are: predictor (defining the model server and artifact URI), transformer (optional pre/post-processing service), canary (a parallel deployment of a new model version for validation), and autoscaling (min/max replicas, target concurrency). The YAML structure makes all of these explicit and version-controllable in Git.
InferenceService Configurations
Getting from a trained model artifact to a live InferenceService requires understanding a few common configuration patterns.
The standard predictor is the most common starting point. You define the model server type (e.g., xgboost, pytorch, tensorflow), point it at your artifact URI in S3 or GCS, and KServe handles the rest. The model downloads at pod startup, the server starts, and the service becomes available.
The transformer pattern becomes necessary when your model server expects clean numerical inputs but your API receives messy real-world data. For example, a text embedding model served via PyTorch expects tokenized input tensors—but your clients send raw text. A transformer receives the raw text, runs a HuggingFace tokenizer, and passes token IDs to the predictor. The predictor stays focused on what it does best: running the model.
Transformers also solve the multi-model serving problem cleanly. You can run multiple predictors behind a single transformer that routes requests by request content (e.g., by model version or input type), creating an inference routing layer without custom code in your model server.
Multi-model serving within a single InferenceService is supported by KServe's InferenceGraph abstraction. Rather than one model per service, you define a graph of models where requests flow through a sequence. This is useful for pipelines like embedding generation followed by nearest-neighbor search, or preprocessing transformers chained with ensemble models.
Storage initialization strategies matter at scale. For development and testing, downloading from S3 at pod startup is fine. For production with large models or GPU inference, pre-staging model artifacts on a PersistentVolumeClaim eliminates the download latency from the critical path on every pod scale-out event.
Canary Deployments for ML Models
One of KServe's strongest production features is native canary deployment support. A canary deployment routes a small percentage of live traffic to a new model version so you can validate it against real data before committing to a full rollout.
Canary deployment validates ML model changes in production with real traffic before full rollout. In KServe, you define both a primary predictor (your current production model) and a canary predictor (your candidate new model) within the same InferenceService. Traffic splitting is controlled by the canaryTrafficPercent field. Setting it to 5 means 5% of requests go to the canary and 95% to the primary. KServe's ingress integration handles the routing—no separate service mesh configuration required.
The ML-specific advantage of canary deployments is prediction validation. Unlike software canaries where you monitor error rates and latency, for ML models you also need to validate that the new model is producing sensible outputs. This means exporting prediction distribution metrics to Prometheus (mean prediction value, class probability histograms, output variance) and comparing them between primary and canary.
Automated canary promotion with tools like Flagger or Argo Rollouts takes this further. These progressive delivery tools integrate with your Prometheus metrics and automatically promote or roll back the canary based on configurable thresholds. Define your SLA: if p99 latency stays below 200ms and error rate stays below 0.1% for the canary over 30 minutes, promote it. If either metric degrades, roll back to the primary automatically. This is the production-recommended approach for teams shipping model updates frequently.
The workflow in practice: deploy v1 as primary → validate offline → add v2 as canary at 5% traffic → monitor for 1 hour → if metrics look good, bump to 25% → monitor another hour → promote to 100% → delete v1. Each step is a single YAML update, versioned and auditable.
Auto-Scaling for Production Inference
KServe's autoscaling story is one of its most compelling production features, but it requires understanding the difference between resource-based and request-based scaling.
The standard Kubernetes Horizontal Pod Autoscaler (HPA) scales pods based on CPU or memory utilization. For a web service this works well—if CPU is high, scale out. But for ML inference, CPU utilization is a poor proxy for actual load. An inference pod can have low CPU because it is waiting on a GPU operation or a slow downstream service, while a queue of requests builds up behind it. The HPA sees idle CPU and does not scale—meanwhile latency spikes for waiting users.
Knative enables request-based auto-scaling by tracking actual concurrent requests rather than CPU. KServe integrates with Knative Serving to provision additional pods when the number of concurrent requests exceeds your targetConcurrency threshold. When concurrency drops, it scales back down.
Key autoscaling parameters in the InferenceService spec:
minReplicas: The floor on pod count. Set to1for latency-sensitive services to avoid cold-start latency. Set to0for batch or asynchronous workloads to enable scale-to-zero.maxReplicas: The ceiling to prevent runaway scaling on traffic spikes.targetConcurrency: The number of concurrent requests per pod before triggering scale-out. Short-inference models can handle higher concurrency. Large model inference or GPU workloads should target lower values (2–5).
Scale-to-zero is a Knative feature that lets inference services consume zero compute when idle. For workloads with bursty traffic patterns—batch inference jobs, on-demand prediction APIs with long idle periods between requests—this can represent significant infrastructure savings. The trade-off is cold-start latency: when a request arrives and no pods are running, Knative must schedule a new pod, download the model, and start the server before responding. Cold starts typically add 30–120 seconds depending on model size. For production APIs with SLA requirements, keep minReplicas=1.
KEDA scales ML inference on queue depth metrics by letting you scale based on external signals rather than request concurrency. Scale your inference pods based on the depth of a RabbitMQ queue, the lag of a Kafka consumer group, or a custom Prometheus query. This is useful when inference demand is driven by upstream data pipeline volume rather than direct API traffic.
Monitoring ML Inference in Production
Production ML inference monitoring has three layers: infrastructure health, request performance, and model behavior over time.
Prometheus monitors inference latency and throughput as the foundation of your observability stack. KServe emits built-in metrics for request latency histograms, request counts, error rates, and resource utilization. Grafana dashboards visualize them.
Infrastructure monitoring covers the basics: pod CPU and memory utilization, GPU utilization and VRAM (critical for GPU inference to catch OOM errors before they happen), pod restart counts, and disk usage for PVC-backed model artifacts.
Request performance metrics are where you catch service-level regressions:
- Inference latency (p50, p95, p99) — measure from predictor pod receipt to response
- Throughput (requests/second) — your capacity baseline
- Error rate — HTTP 5xx responses from the inference service
- Queue depth — leading indicator of latency degradation
Model behavior monitoring is the layer most teams overlook until it is too late. Two key phenomena to track:
Data drift occurs when the distribution of input features changes over time. Tools like Evidently AI or Alibi Detect integrate with KServe to compute drift metrics and alert when statistical thresholds are exceeded.
Prediction drift tracks changes in model output distribution. Track the mean and variance of prediction outputs weekly; if they shift significantly without a corresponding change in input distribution, investigate.
Set up alerts on p99 latency exceeding your SLA threshold, error rate above 1%, and prediction distribution divergence exceeding three standard deviations from baseline. Route these to your incident management tool so they surface to the on-call engineer before users notice.
Conclusion
Kubernetes and KServe together provide a production-grade ML inference platform that rivals managed cloud services while giving you full control over your infrastructure. The key architectural advantages are the InferenceService CRD for declarative deployment, the transformer pattern for clean separation of preprocessing from inference, native canary traffic splitting for safe model rollouts, and Knative enables request-based auto-scaling for handling variable production load.
Getting started is straightforward: install KServe on any Kubernetes cluster, define your first InferenceService with a simple predictor, and you have a live model endpoint. From there, add transformers as your preprocessing needs grow, configure canary deployments for every model update, set up Prometheus monitoring, and integrate KEDA if your scaling signals come from upstream pipeline volume.
In 2026, KServe is the standard self-hosted ML serving platform for teams that need framework portability, auto-scaling, and production-grade reliability without cloud vendor lock-in.