LLM Observability in Production: From Prompt Logs to Real-Time Debugging
A practical guide to LLM observability covering prompt logging, real-time debugging, evaluation frameworks, and the major platforms for shipping reliable AI applications.
When a traditional API fails, you get an HTTP error code. When an LLM application fails, you get a confidently wrong answer. That difference is why observability for large language models is not optional — it is the foundation of reliable AI products.
Teams deploying LLMs in production face a unique problem: the model is a black box that generates non-deterministic output. A prompt that worked yesterday can return a hallucinated response today. A temperature setting that produced concise answers last week can now produce verbose ones. Without visibility into what is happening inside your LLM pipeline, you are flying blind.
This guide covers everything you need to build production-grade LLM observability: the conceptual stack, implementation patterns, debugging techniques, evaluation frameworks, and a honest comparison of the major tools.
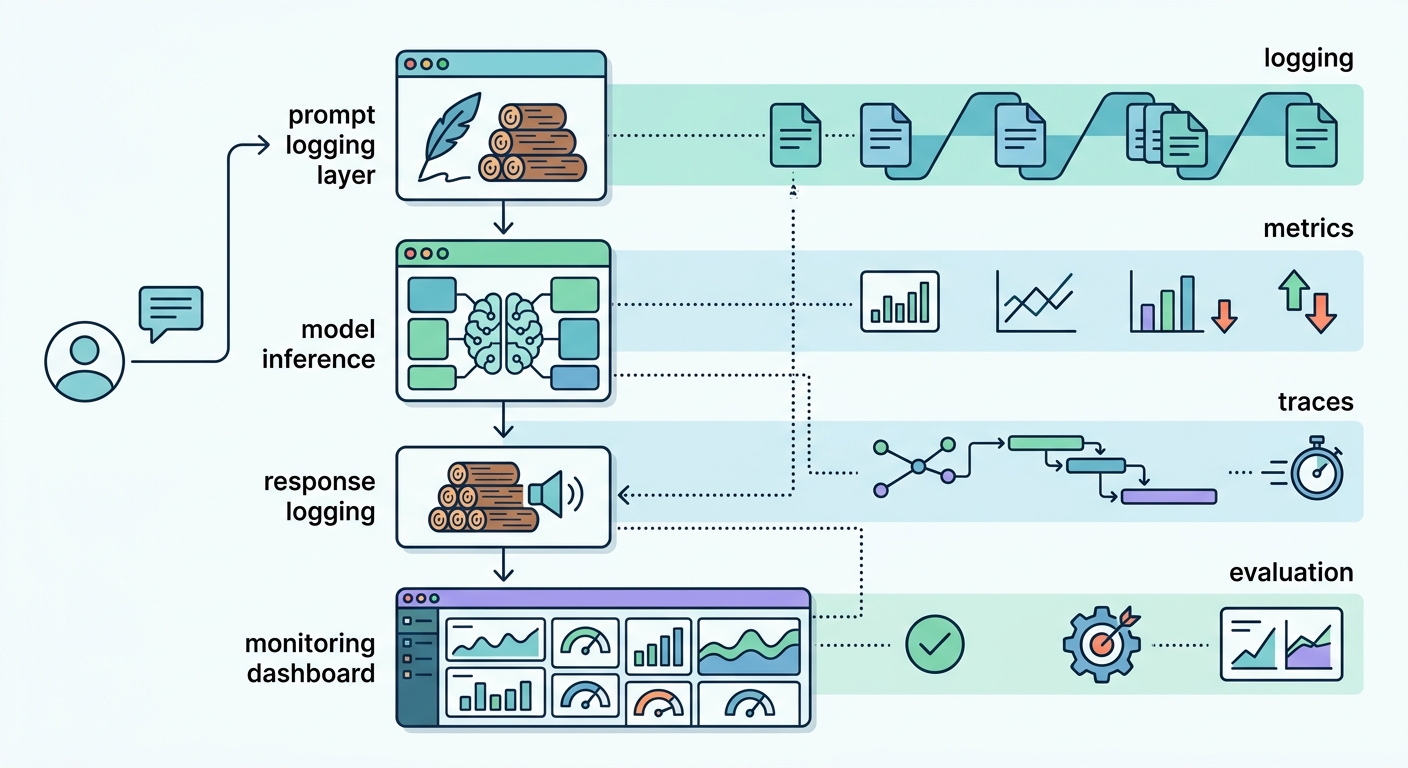
The Observability Stack: Logging, Metrics, and Traces
LLM observability rests on three pillars, each answering a different question.
Logging captures the raw material: every prompt, every response, every token. Logs are your post-mortem data. When a user reports a bad answer, logs let you replay the exact sequence that produced it. What user input triggered the failure? What system prompt was active? What retrieval results were included in the context?
Metrics aggregate operational signals over time. Token consumption per minute. Request latency p50, p95, and p99. Error rate — where an error is any response that fails a quality check or returns a non-200 status code. Since LLM APIs bill per token rather than per second, track cost per 1,000 tokens and cost per request to establish meaningful baselines. Metrics answer the question: is the system healthy right now?
Traces connect all the components in a single request chain. A user query passes through retrieval, prompt assembly, model inference, and response parsing. A trace links these steps together so you can see exactly where latency was added or where the retrieval returned a misleading document.
Evaluations measure output quality. This is the layer that is hardest to get right and most often skipped. Evaluation answers: is the model giving good answers, not just fast ones?
These four layers work together in a loop. You emit signals, store them, analyze them, alert on anomalies, and improve the system based on what you find.
Prompt Logging at Scale
The first and most critical step is logging every LLM call.
What to Capture
A complete log entry should contain:
- The user input (the raw query)
- The system prompt or instruction string
- Any few-shot examples included in the context
- The full model response
- Token counts (input and output)
- Model name and version (critical when you upgrade models)
- Latency in milliseconds
- A unique request ID for correlation with traces
Without this data, debugging is impossible. With it, you can replay any production interaction.
Storage Architecture
Prompt logs are voluminous. A moderately busy application generates gigabytes per day. Choose your storage based on how you will query it.
Row-based formats like Parquet work well for full-text search and offline analysis. Columnar stores like BigQuery handle aggregate queries efficiently. Document databases like MongoDB shine when you need to query by request ID or user ID.
Most teams start with a simple PostgreSQL or MongoDB setup and migrate to a specialized analytical store once they hit scale.
PII and Compliance
Prompts often contain user data — names, email addresses, account details. This creates compliance obligations under GDPR, SOC 2, and other frameworks.
The standard approach is a redaction pipeline. Before logs are written to persistent storage, a PII detection step scrubs sensitive fields. Email addresses become USER_EMAIL, phone numbers become USER_PHONE. The redaction key lets authorized personnel reconstruct original inputs when needed for debugging, without storing raw PII in your log store.
Sampling and Cost Control
Logging every request gets expensive at scale. A practical strategy: sample 10% of successful requests and log 100% of errors. Errors are the interactions you most need to debug. Successful interactions need less frequent sampling once you have a baseline.
Prompt Versioning
Treat your prompts like source code. When you change a system prompt, you need to know what changed, who changed it, and how it affected output quality. PromptLayer and similar tools provide Git-like versioning for prompts — diffs, rollbacks, and the ability to tag prompts by model version.
Real-Time Debugging: Detecting and Diagnosing Failures
Logging tells you what happened after the fact. Real-time debugging tells you while it is happening.
Threshold Alerting
Define alerts on your operational metrics. The most useful thresholds:
- Latency: Alert when p99 latency exceeds 5 seconds for interactive applications, or when latency increases 50% compared to the previous 24 hours
- Error rate: Alert when more than 1% of requests fail quality checks or return error status codes
- Cost velocity: Alert when token spend exceeds 2x the rolling hourly average
When setting latency thresholds, account for context length. The same model serving a 2,000-token input will produce dramatically different latency than an 80,000-token input — often 10x or more. Alert on latency relative to context length, not absolute thresholds. Segment your metrics by context length bucket (under 4K tokens, 4K–32K, above 32K) and set thresholds per bucket. This prevents alert fatigue from legitimate latency variation across different query types.
Set alerts in your existing incident management tool — PagerDuty, OpsGenie, or a Slack channel with clear on-call ownership.
Output Quality Checks
Not all failures are obvious. A 200 OK response can contain hallucinated data or off-topic content. Automated quality checks catch these silent failures.
Regex patterns catch known-bad outputs. If your application should never return a response containing the phrase "as an AI language model," a regex check on every response catches violations.
LLM-as-judge uses a second LLM to evaluate the output. You prompt GPT-4o or Claude to score the response on accuracy, relevance, and helpfulness from 1 to 5. This catches subtle quality issues that regex cannot detect.
Regression Detection
When you update your model, retrieval system, or prompt template, you risk degrading output quality. Regression detection compares new outputs against a golden dataset — a set of inputs with known-good outputs.
Run your entire golden dataset against the new version and compare scores. If average quality drops by more than 5%, investigate before deploying. This is analogous to unit testing in traditional software — your golden dataset is the test suite.
Trace Analysis
When an alert fires, you need to drill into a specific request trace to understand root cause. A trace shows you the complete request chain:
- User query arrives
- Retrieval system returns top-K documents
- Prompt template assembles system instruction + retrieved docs + user query
- Model inference runs
- Response is parsed and returned
Trace analysis answers: was the failure in the retrieval step (wrong documents retrieved), in the prompt assembly step (wrong template, wrong formatting), or in the model step (model misinterpreting a correct prompt)?
LangSmith provides a visual trace debugger that shows each step with its latency contribution. For custom stacks, OpenTelemetry instrumentation with a distributed tracing backend like Jaeger or Grafana Tempo gives you the same capability.
Evaluation Frameworks: Measuring Quality Over Time
Debugging is reactive — you fix what is broken. Evaluation is proactive — you prevent regressions before they reach production.
Golden Dataset Evaluation
A golden dataset is a curated collection of 50 to 500 representative inputs paired with expected outputs. These inputs cover the diversity of real user queries: common cases, edge cases, known failure modes.
Every code change or model upgrade triggers a full golden dataset evaluation. You compute pass rates, average scores, and per-case results. A CI/CD gate blocks deployment if scores drop below a defined threshold.
Eval scores are continuous variables, not binary pass/fail signals. Calibrate your deployment gate threshold against your historical false positive rate. Track how often your eval pipeline blocked a deployment that turned out to be fine, and adjust accordingly. Overly strict gates create friction and encourage teams to bypass the evaluation process. Overly loose gates let regressions reach production. Review and recalibrate quarterly as your golden dataset grows.
Golden datasets require upfront effort to create but pay dividends continuously. The key is curation: include cases that represent real production traffic, not just idealized scenarios.
LLM-as-Judge
Human evaluation is the gold standard but does not scale. LLM-as-judge automates quality scoring by using a second, often more capable, model to evaluate outputs.
The judge prompt matters. A well-designed judge prompt specifies evaluation dimensions — accuracy, relevance, coherence, safety — and provides clear rating criteria. For example: "Rate accuracy from 1 to 5. A 5 means the response contains no factual errors. A 1 means the response contains multiple significant factual errors."
LLM-as-judge is not perfect. It can be biased toward longer responses, more confident responses, or responses that resemble the judge's own style. Use it as a signal, not absolute ground truth.
A/B Evaluation
When comparing two model versions or two prompt templates, run both on the same golden dataset and compare aggregate scores. Use statistical significance testing — a 2% improvement on 50 samples is not statistically meaningful. Run enough samples to detect meaningful differences with 95% confidence.
Continuous Evaluation Pipelines
Mature teams integrate evaluation into their CI/CD pipeline. On every pull request that changes prompts, retrieval, or model configuration:
- Run the full golden dataset against the proposed change
- Compare scores against the production baseline
- Post results to the pull request as a comment
- Require reviewer approval if scores regress
This workflow catches quality regressions before they reach users.
Tool Landscape: Comparing Major Platforms
The LLM observability space has exploded since 2023. Here is how the major platforms compare.
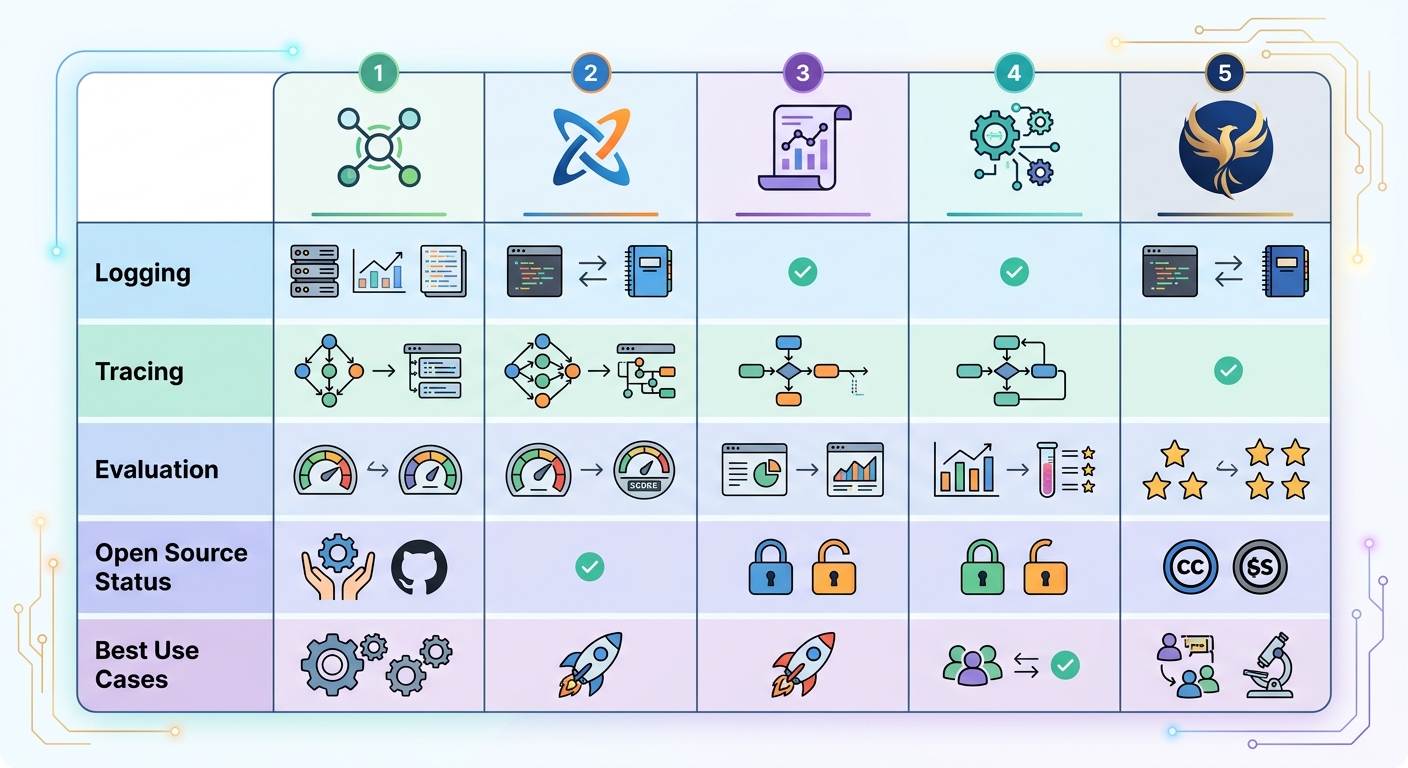
LangSmith from LangChain is the most complete end-to-end platform. It handles logging, distributed tracing, evaluation datasets, and CI/CD integration. If you are building on LangChain, LangSmith is the natural choice. The trade-off is vendor lock-in — it works best within the LangChain ecosystem.
Helicone takes a proxy-based approach. You point your LLM API calls through Helicone's proxy, and it logs everything automatically with zero code changes. It is open source and self-hostable. Helicone is excellent for teams that want full control and do not want to adopt a full-featured platform.
PromptLayer focuses on prompt management and versioning. Its killer feature is treating prompts like Git repositories — with diffs, rollbacks, and tags for different model versions. Logging is included but less sophisticated than LangSmith.
Braintrust emphasizes evaluation quality. It provides pre-built evaluation datasets, automated regression testing, and scoring infrastructure. If your primary concern is output quality and you need rigorous benchmarking, Braintrust is the strongest option.
Phoenix from Arize is the open-source choice for teams with custom-built LLM stacks. It uses OpenTelemetry under the hood and integrates with standard observability backends. If you are not using LangChain or another framework, Phoenix gives you structured tracing and evaluation without platform lock-in.
Implementation Checklist
Ready to get started? Here is the minimum viable observability setup.
-
Log every LLM call. Wrap your API calls in a logging layer. Capture prompt, response, tokens, latency, and request ID. Store in your existing data infrastructure.
-
Set up basic metrics. Track cost per hour, latency p50/p95/p99, and error rate. Create a Grafana dashboard. Define alert thresholds and route alerts to your incident management tool.
-
Create a golden dataset. Start with 50 representative inputs and write expected outputs. Grow it over time as you encounter new failure modes in production.
-
Run baseline evaluation. Before you optimize anything, know your current quality score. This gives you a reference point for measuring improvement.
-
Implement threshold alerts. Start with latency and error rate. Add cost velocity alerts once you have a baseline for token spend.
-
Adopt prompt versioning. Use PromptLayer, or at minimum, maintain prompts in Git with explicit version tags. Never change a production prompt without a versioned artifact.
-
Review weekly. Allocate time to review top failing cases, cost anomalies, and latency trends. Observability data is only valuable if someone acts on it.
LLM observability is not a feature you add once. It is an ongoing practice. The teams that ship reliable AI products are the ones that treat observability as a core part of their engineering workflow — not an afterthought.
Author: Algorithmine Team