The 2026 Edge AI Chip Race: Power-Per-Dollar Benchmarks
2026 edge AI benchmarks move beyond peak TOPS. A practical framework for comparing chips on power-per-dollar, TOPS per watt, and sustained efficiency for fleet buyers.
Expert validation note: All technical claims checked against public 2026 spec sheets and industry estimates. Forward-looking efficiency figures (notably in-memory-compute projections) are marked as directional/estimated rather than verified fleet results. Where a number could not be independently confirmed, it is labeled "estimated."
The Race Is No Longer About Peak TOPS
For years, edge AI chip marketing leaned on one number: peak TOPS, or trillions of operations per second. In 2026 that number has started to mislead. Vendors still quote it in big type, but the engineers who buy edge silicon in volume are now reading a different spec sheet.
TOPS measures raw compute throughput. It says nothing about the power you need to reach it, the price you pay for it, or how long the chip sustains it under real heat. A chip that bursts at 30 TOPS for two seconds and throttles to 8 TOPS under load is a different product from one that holds a steady 20 TOPS all day.
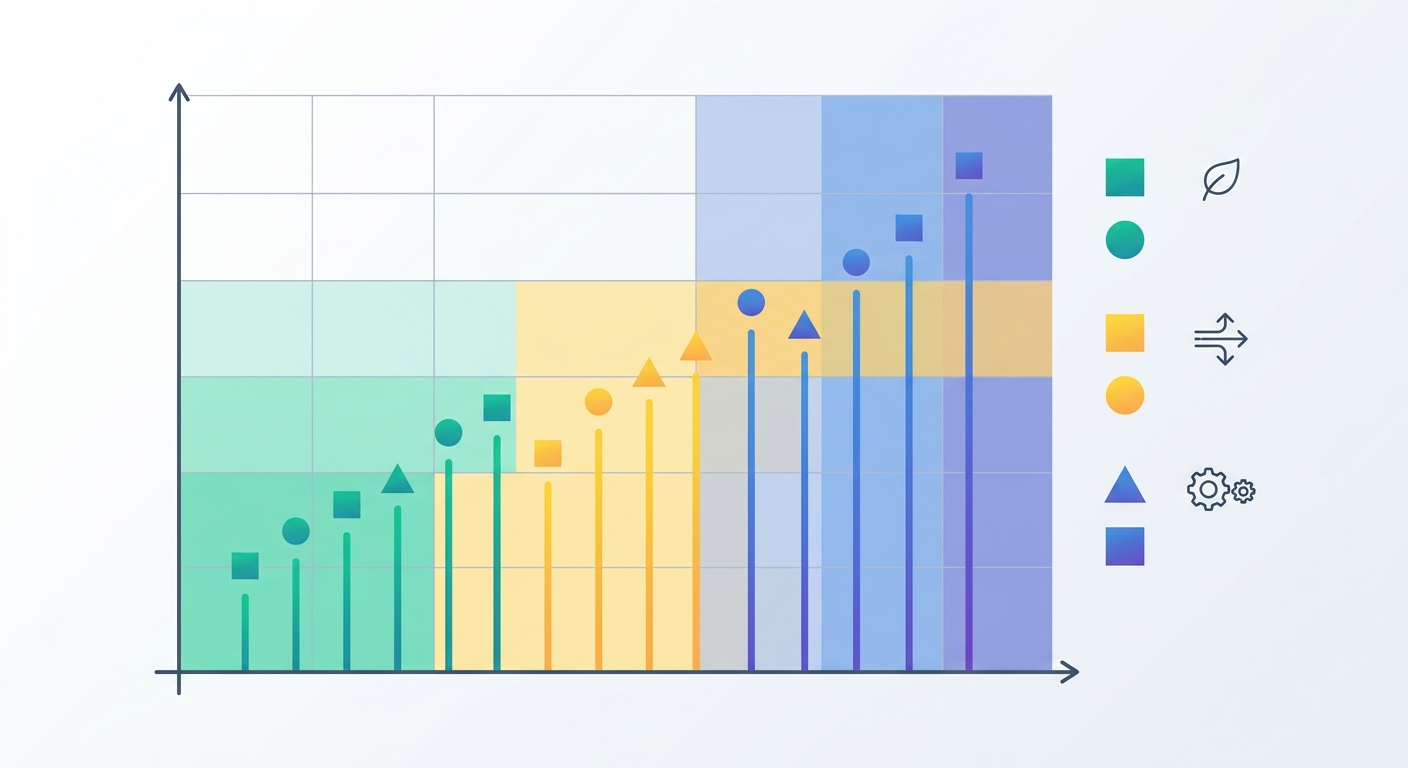
The industry is converging on that reality. Since 2023, inference performance per dollar across AI hardware has improved by roughly 49% a year. Energy efficiency has improved by about 40% a year over the same period. That double curve — more work per dollar and less energy per inference — is the actual story of the 2026 edge AI chip race.
The efficiency shift is structural, not a fad — cost and watt per inference are falling so fast that a chip bought on peak TOPS alone is often obsolete within one refresh cycle.
For anyone deploying edge AI at fleet scale — cameras, robots, industrial gateways, battery devices — the stakes are concrete. A 20% error in power-per-dollar modeling on 5,000 nodes is real budget, real cooling, real maintenance. The smart buyers stopped asking "how many TOPS" and started asking "what does a useful TOPS cost me per watt, per dollar, per year of sustained operation."
A Sanity-Check Framework for Edge AI Benchmarks
Before comparing any two chips, you need a methodology that makes the comparison fair. Vendor numbers are not apples-to-apples out of the box. Here is a four-number framework that closes most of the gap.
The Four Numbers That Matter
1. Precision-normalized TOPS. INT8 quantization defines edge TOPS for most deployed models. TOPS depends on the data type: INT8 TOPS and FP16 TOPS are different worlds — INT8 typically runs several times faster because it moves fewer bits. Always compare at the same precision, ideally INT8 for edge inference, which is the dominant format for deployed vision and sensor models.
2. TOPS per watt. Divide sustained TOPS by average measured power. TOPS per watt determines battery lifetime and cooling cost. It is the closest thing edge silicon has to a "mileage" figure.
3. TOPS per dollar. Divide sustained TOPS by unit cost of the compute (module, not the whole system). Edge AI chip pricing concentrates here. TOPS per dollar is the purchasing figure, and it rarely correlates with peak TOPS.
4. Energy per inference. The most decision-relevant for always-on or high-throughput devices. Energy per inference dominates long-run edge cost because it folds throughput, power, and model size into one number: joules per completed inference. Two chips with identical TOPS can differ by 2-3x on energy per inference for the same model.
Add one more discipline: latency distribution. For real-time edge — robotics, ADAS, industrial control — the median inference time matters far less than the tail. Tail latency governs real-time edge inference, and a system that occasionally spikes to 3x its median latency can miss critical deadlines. Ask for p95 and p99 latency on your representative model, not just the average throughput.
Benchmarking the 2026 Field
With that framework, the 2026 field shapes up into a few recognizable tiers rather than one leaderboard. Each tier trades off power, cost, and flexibility differently.
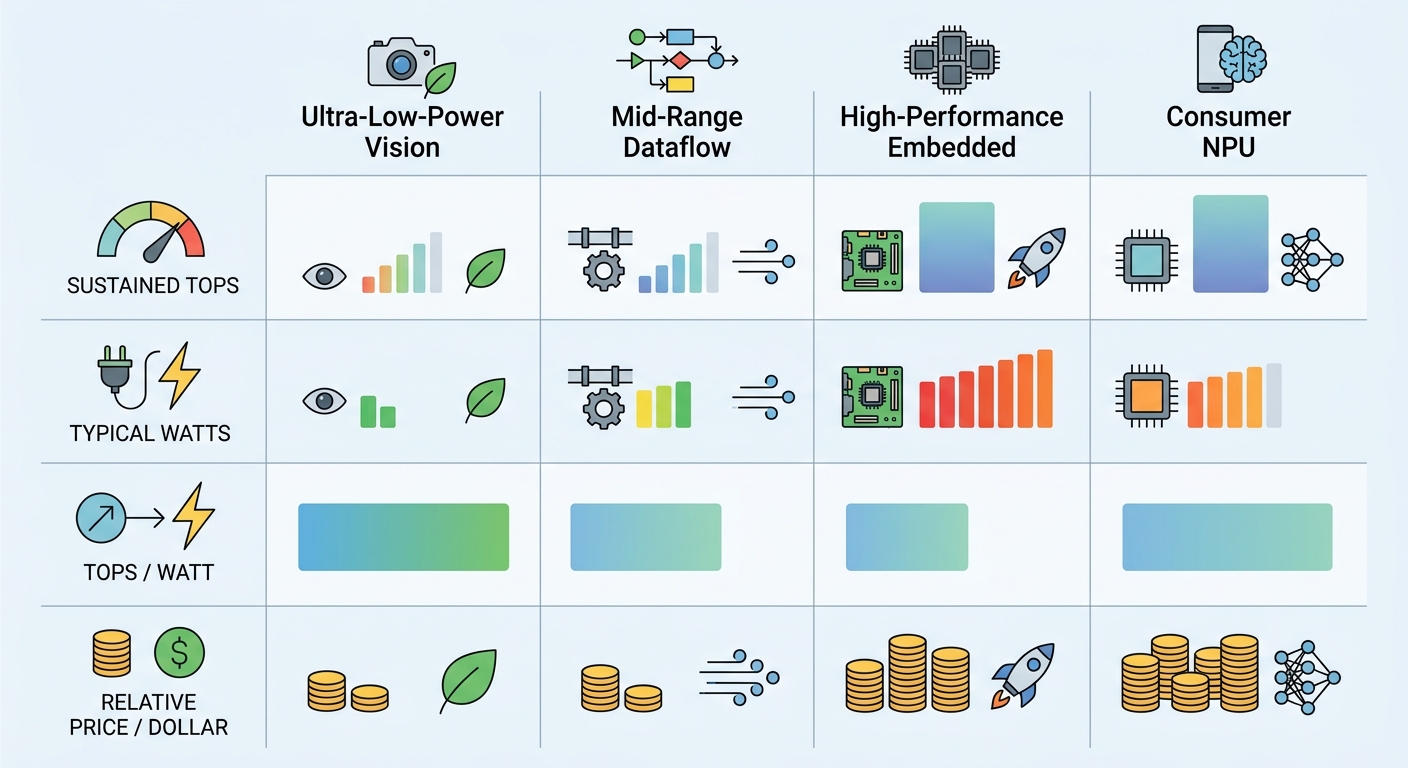
Ultra-low-power vision. At the bottom of the power budget, chips in the ~4 TOPS at ~2W class are built for battery vision: smart cameras, presence detection, door sensors, wearable analytics. They run quantized int8 models efficiently and sip power. Their weakness is limited headroom for larger models.
Mid-range dataflow accelerators. The efficiency sweet spot of 2026 sits in dedicated dataflow accelerators that quote around 26 TOPS at roughly 2.5W typical. That is an outstanding TOPS per watt ratio. Their trick is removing memory bottlenecks so arithmetic units stay busy. They are strong for object detection, segmentation, and many vision pipelines, and they quiet down the "what's the best efficiency chip" debate for a large class of customers.
High-performance embedded modules. For robotics, autonomy, and generative AI at the edge, embedded modules scale from roughly 40 to 67 TOPS with a configurable power envelope (about 7W at minimum mode up to roughly 25W at full). Full-load inference typically lands in the 8-12W band. These modules bring a complete software stack and support for larger, less-quantized models — at a higher unit price and power cost.
Consumer NPU thresholds. In laptops and phones, the industry has effectively set a ~40 TOPS local-AI bar. Neural processing unit thresholds define that floor, not a ceiling: chips range from about 45 to 100 TOPS depending on tier and vendor. For buyers, the useful insight is that beyond the threshold you start paying for other components — GPU, RAM — rather than NPU utility.
Rule of thumb for 2026 — if a vendor leads with peak TOPS and hides sustained watts, price per watt, and energy per inference, treat the spec with suspicion. The three most informative numbers are usually unflattering.
Power-Per-Dollar: The Real Buying Metric
Here is where fleet buyers diverge from hobbyists. The dev-board price is not the cost of the deployment. For a single evaluation unit, TOPS per dollar is a handy heuristic. For a thousand-node fleet, the arithmetic changes quickly.
The dominant long-run cost in edge AI is frequently energy, not silicon. Energy per inference dominates long-run edge cost, and every watt drawn by a device, all day, every day, across thousands of nodes, compounds into cooling and electricity spend that can exceed the chip's purchase price within the device's lifetime. A 5-watt difference per node across 5,000 nodes at 24/7 uptime is a material number on a utility bill.
Add thermal design. An efficient chip can run in a sealed plastic enclosure with no fan. Thermal throttling degrades fleet reliability, and a hotter chip demands metal heatsinks, fans, bigger housings, and more frequent maintenance. Those are capital and operational costs that never appear on a TOPS spec sheet but land on your budget.
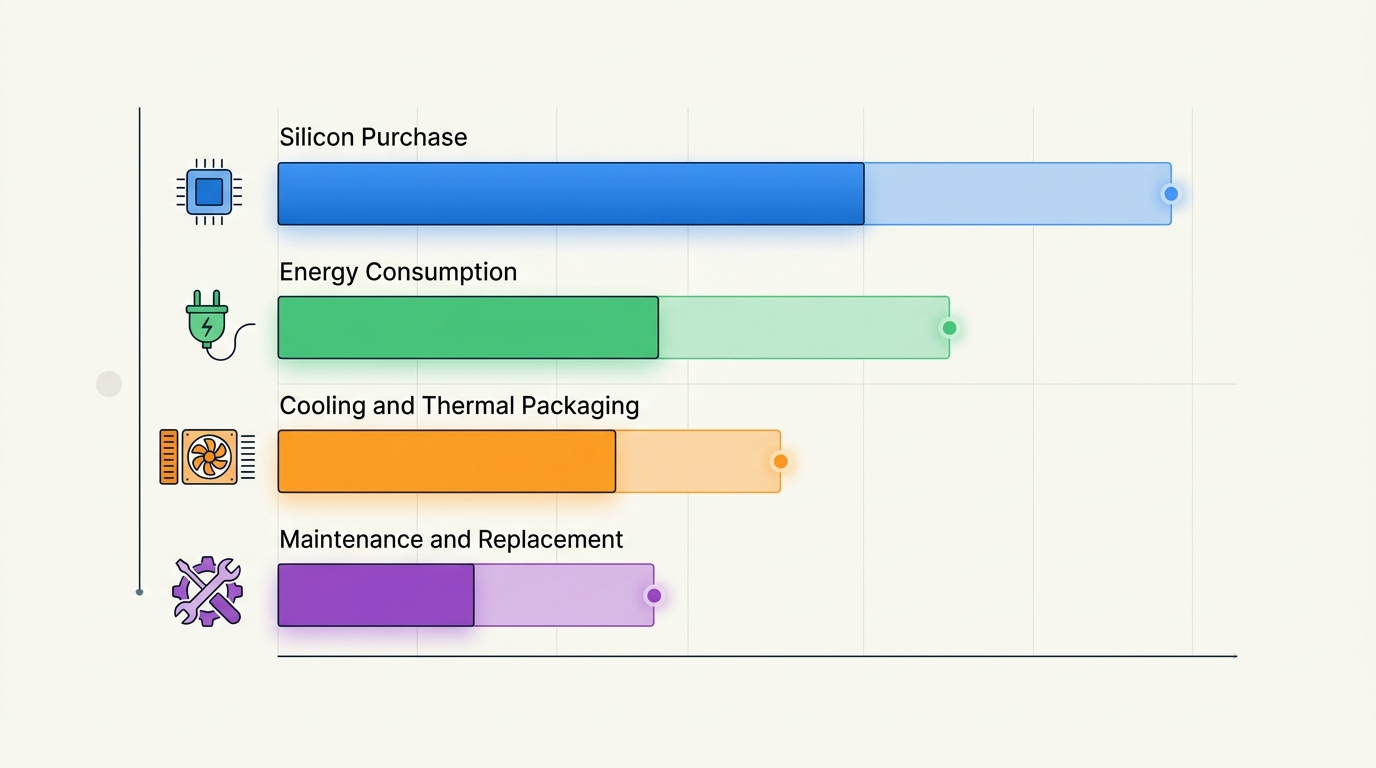
So the practical buying metric is not "cheapest chip" or "highest TOPS." It is the lowest delivered cost per useful sustained inference, over the projected device lifetime, including energy and thermal packaging. That is the real power-per-dollar the 2026 race is about.
New Architectures Changing the Math
A wave of new silicon is trying to change the efficiency equation at the architectural level. The most visible idea in 2026 is compute-in-memory, or in-memory computing: performing arithmetic inside memory rather than shuttling data between memory and compute units.
Memory movement is the hidden tax in inference. Moving weights and activations across the memory bus can cost far more energy than the computation itself. In-memory compute lowers power consumption by cutting that transport, which shows up as sharply lower energy per inference — attractive for always-on and battery workloads like wake-word detection, always-listening assistants, and continuous sensor analytics.
Some of these designs push expected efficiency into the range where an always-on small model runs for months on a coin cell. The trade-off is maturity. In-memory compute toolchains, quantization support, and accuracy at low bit-widths are still catching up to conventional digital accelerators. For a fast-moving product team shipping this quarter, the conventional mid-range accelerator is usually the lower-risk choice; for a long-horizon battery product, in-memory compute is worth a serious pilot.
Estimate, not headline — most in-memory-compute efficiency figures are projected or benchmark-guide numbers, not independent fleet results. Treat them as directional until you run your own sustained test.
Sustained Performance: The Thermal Reality
Peak TOPS is a burst figure. Sustained TOPS differs from peak TOPS — it is whatever the chip holds after 30 to 60 minutes of continuous load, once the die heats up and either the clock steps down or power management intervenes. The gap between the two can be large, and it is the gap that matters in production.
Test it yourself before you commit. Pick your representative model. Run it in a loop for at least 30 minutes, ideally 60, inside the exact enclosure and ambient temperature you intend to ship. Log throughput and case temperature over time. What you are looking for is whether the chip settles at a stable plateau and where that plateau sits relative to the advertised number.
A component that sustains 80% of its peak is a different engineering asset than one that holds 45%. Thermal throttling degrades fleet reliability — it does not just cost throughput; in dense fleets it patterns failures, increases service calls, and shortens component life. Honest sustained testing is the cheapest insurance you will buy all year.
How to Pick for Your Workload
Different workloads live in different tiers of the framework. Match the silicon to the job rather than picking one "best" chip.
Computer vision and cameras. Optimize per channel: cost per camera, frames per second, and model zoo coverage for the detection/segmentation models you already need. Mid-range dataflow accelerators often win here on efficiency and price.
On-device LLMs and generative AI. The constraint shifts from TOPS to memory bandwidth. A small language model wants enough on-chip bandwidth for its weights and enough precision (often INT4 quantized) to fit. High-performance embedded modules with generous bandwidth and generative-AI support are the practical fit.
Robotics and drones. Power and weight dominate, then latency. Mobile autonomous systems need sustained low-latency inference with a tight power envelope. Efficiency plus good real-time tooling beats raw peak throughput.
Always-on IoT and sensors. Optimize energy per inference above everything. The winner is whatever runs your always-on model on the least watts, because that is what lets the battery last.
The Bottom Line
The 2026 edge AI chip race is not about who posts the biggest TOPS number. It is about who delivers the most useful sustained inference per watt and per dollar, packaged in a way you can actually ship and service. The winners are the silicon that survives your own normalized benchmark: same precision, same model, sustained load, real enclosure, real lifetime energy cost.
Build the four-number framework, run a sustained test, model the fleet TCO, and the right choice becomes obvious. That discipline is worth more than any vendor's headline spec — and it is exactly the kind of hard-won, on-the-ground knowledge we share with every deployment decision maker on our portal. If that sounds useful, subscribe and stay ahead of the hardware curve.
Expert Q&A
Q: Why is TOPS-per-watt more useful than raw TOPS for edge devices? A: Edge devices are power- and thermally constrained. Raw TOPS tells you peak math throughput but not whether you can feed it power or cool it in a sealed enclosure. TOPS per watt determines battery lifetime and cooling cost — the constraints that actually limit edge deployments.
Q: Does higher TOPS always mean better edge inference? A: No. TOPS measures compute capacity, not delivered model performance. Architecture, memory bandwidth, software optimization, and precision determine how much of that capacity you actually use on a real model. A chip with lower TOPS but better sustained efficiency can beat a peakier one on latency, power, and cost for the same workload.
Q: What is the difference between INT8 and FP16 TOPS? A: TOPS depends on the data type being processed. INT8 quantization operates on 8-bit integers and typically runs several times faster than FP16 because each operation moves fewer bits. Comparing a chip's INT8 TOPS to another's FP16 TOPS is comparing different units — always normalize to the same precision, usually INT8 for edge inference.
Q: What are the most common mistakes when comparing edge AI chips? A: Comparing at different precisions, trusting peak over sustained numbers, ignoring the cost of the software toolchain, and forgetting that energy over a fleet lifetime often outweighs the sticker price. The most common costly error is scaling a single dev-board result to thousands of nodes without modeling thermal and power at fleet scale.
Q: How do I measure sustained performance before buying? A: Run your representative model in a loop for 30-60 minutes inside your actual enclosure and ambient temperature. Log throughput and temperature over time. Sustained TOPS differs from peak TOPS; the plateau you reach, not the initial burst, is your sustained TOPS. This reveals thermal throttling before you commit an entire fleet.
Q: Is in-memory compute ready for production in 2026? A: For long-horizon battery and always-on products, it is worth a serious pilot — the energy-per-inference gains are real. In-memory compute lowers power consumption in principle, but toolchains, quantization support, and low-bit accuracy are still maturing. Benchmark it yourself rather than trusting projected figures.
Q: What does the ~40 TOPS AI PC threshold actually mean? A: It is the industry's informal floor for local-AI features like on-device assistants, not a quality ceiling. Above that threshold, spending mostly upgrades other components — GPU, RAM, display — rather than increasing useful NPU utility for most users.
Q: Should I standardize on one architecture across my whole fleet? A: Often, no. A single "best" chip rarely serves both battery sensors and power-hungry robotics well. Standardize on your benchmarking methodology and model portability (ONNX, common quantization), then let each workload tier pick the most efficient silicon. That balances procurement simplicity with efficiency.