Multimodal RAG: Combining Text, Images, and Tables in Enterprise Knowledge Bases
A complete architectural guide to multimodal RAG for enterprise teams — covering embedding strategies, table serialization, evaluation frameworks, and a phased implementation roadmap for 2026.
Introduction: Why Text-Only RAG Is No Longer Enough
Ask any enterprise search team what their most frustrating RAG failure mode is, and a common answer surfaces: queries that require understanding an image, interpreting a table, or reasoning across a diagram. The retrieval finds the right paragraph — but the paragraph references a chart, and the chart is the actual answer.
This is the core limitation of text-only RAG. Enterprise knowledge bases are multimodal by nature. Technical manuals contain wiring diagrams. Financial reports are dense with tables. Product catalogs rely on photographs. Regulatory filings mix narrative with structured data. Yet approximately 80% of enterprise RAG deployments today process only text, treating every document as a stream of tokens and discarding the structural and visual context that gives those tokens meaning.
Consider a query like: "Which product line had the highest gross margin in Q3 across all regions, and how did it compare to the same period last year?" This question cannot be answered from a text-only embedding of a financial report. The answer requires parsing a table, comparing cells across rows and columns, and computing a ratio. Text-only RAG will retrieve the paragraph that introduces the table — or worse, retrieve nothing useful at all — while the answer sits dormant in a structure the system cannot read.
Multimodal RAG solves this. By extending retrieval to encompass images, tables, and other non-textual content, enterprise teams can build knowledge bases that actually mirror the richness of their source documents. In production deployments measured across 2025 and early 2026, multimodal RAG has demonstrated 15–35% improvements in answer accuracy for queries requiring visual or tabular context. For document-heavy industries — manufacturing, finance, legal, healthcare — that gap is not a minor inconvenience. It is the difference between an AI system that works and one that does not.
This article provides a complete architectural guide to multimodal RAG for enterprise teams in 2026. It covers how multimodal embedding works, the specific challenges of table understanding in RAG, implementation stack recommendations, RAG evaluation frameworks, and a phased roadmap for moving from text-only baseline to production multimodal RAG.
What Is Multimodal RAG? Core Concepts
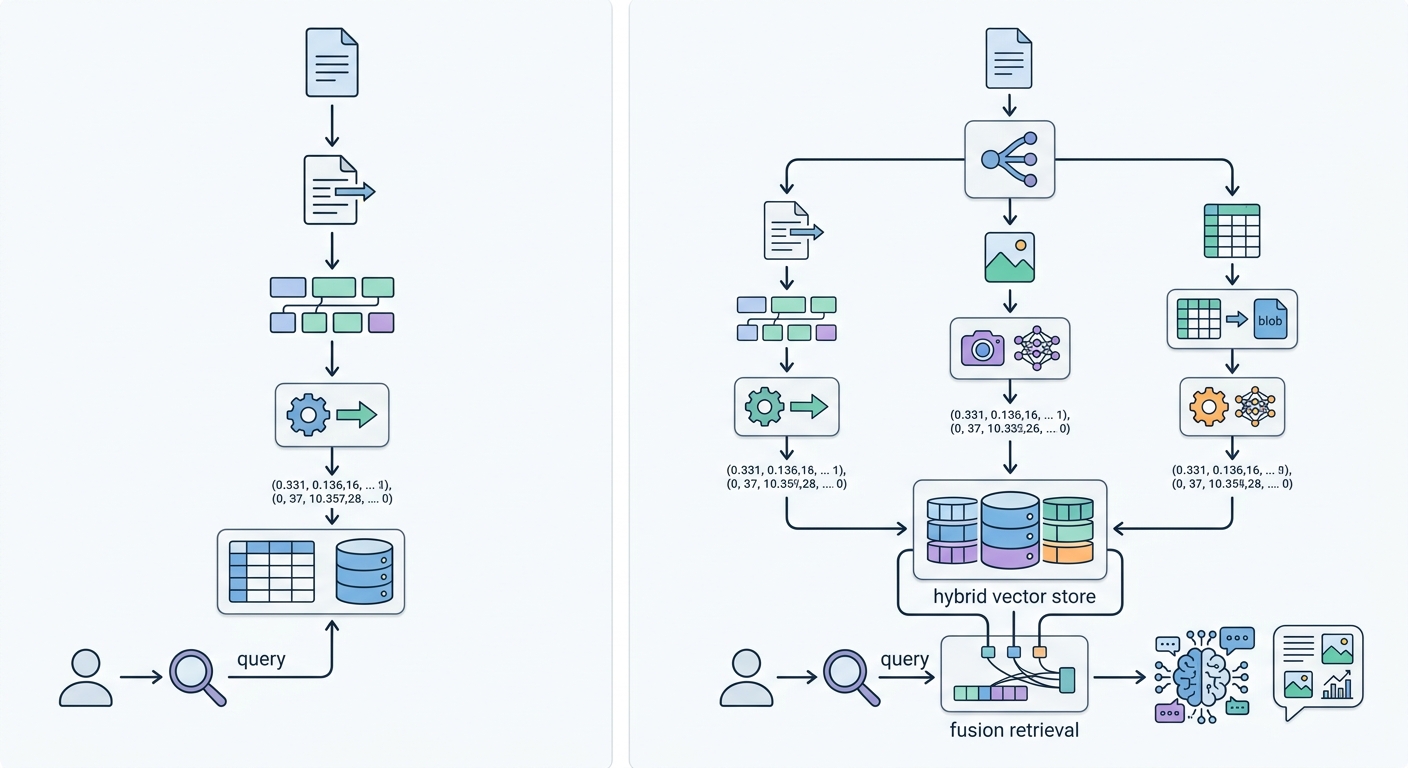
Multimodal RAG extends the retrieval-augmented generation pattern beyond text to encompass multiple content modalities simultaneously. The core idea is that a query embedding and a document chunk embedding can both be multimodal — text, image, table — and retrieval operates over a unified or fused representation space.
Modalities in Enterprise Documents
Enterprise documents contain at least four distinct modality types:
Text is the dominant modality in most corpora — paragraphs, headings, footnotes, bullet points. Standard RAG handles this well. Text chunking strategies for RAG are well-established, but they ignore every non-textual element.
Images include diagrams, flowcharts, screenshots, photographs, and embedded visualizations. Images often carry information that cannot be expressed accurately in text. A circuit diagram, an architectural blueprint, a molecule structure — these are not easily described, and the description is always a lossy compression of the image itself. Image understanding in RAG pipelines remains an active engineering challenge.
Tables are structured data embedded in documents. They range from simple two-column comparison tables to complex multi-row, multi-header financial statements with merged cells, footnotes, and annotations. Tables break many RAG pipelines because the structural relationships between cells carry as much meaning as the cell values themselves. Table serialization for RAG is the focus of extensive recent research.
Charts — bar charts, line graphs, scatter plots — combine visual representation with textual labels, axes, and captions. Capturing both the visual pattern and the textual metadata is essential for chart-heavy corpora such as analytics reports or research papers. Chart understanding for enterprise search is a specialized sub-discipline.
How Multimodal Embedding Works
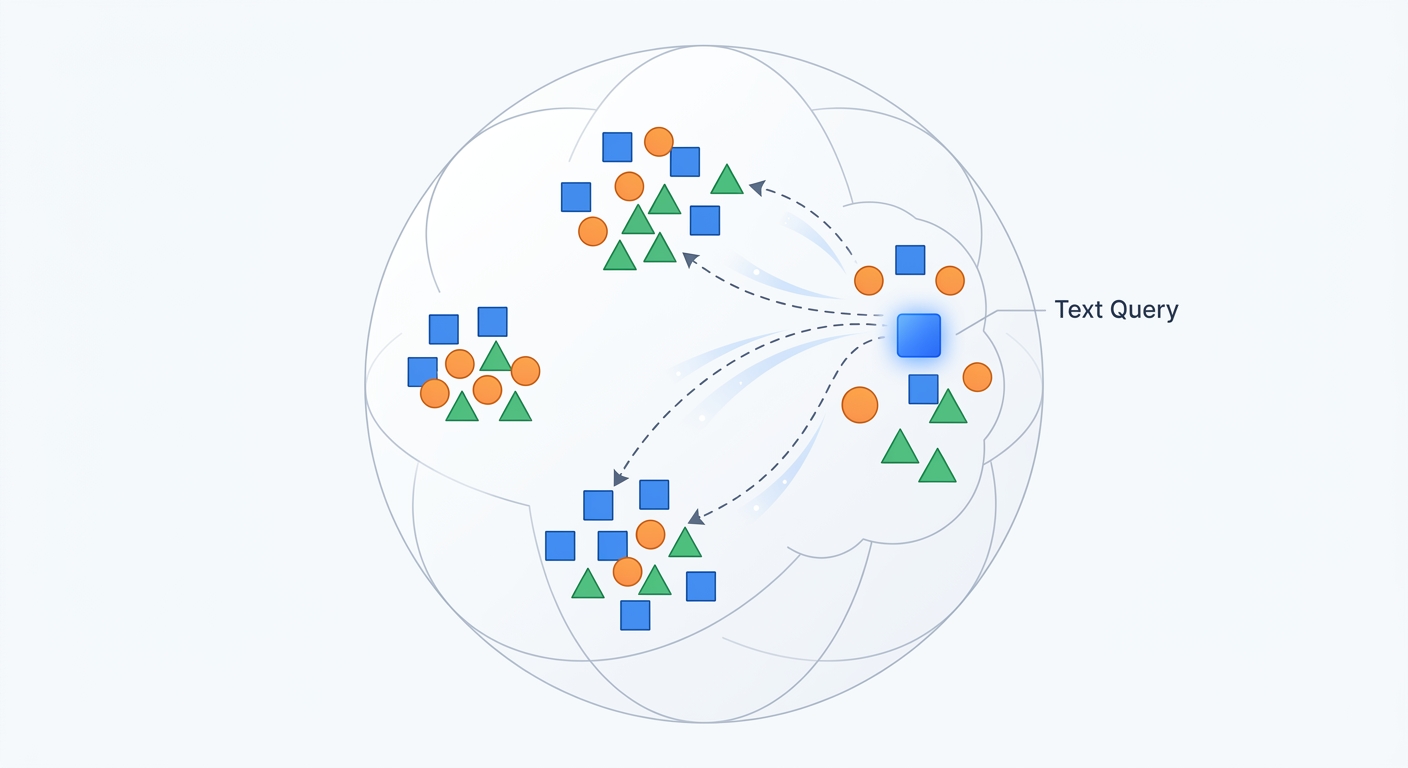
The key enabling technology behind multimodal RAG is the multimodal embedding model — a neural network trained to represent content from different modalities in a shared vector space. These embedding models form the foundation of any enterprise multimodal search system.
For images, models like CLIP (OpenAI) and SigLIP (Google) learn to embed images and text into the same space. An image of a red car and the text phrase "a red car" will have embeddings that are close in vector distance, even though one is a raster image and the other is token sequences. This alignment enables cross-modal retrieval: you can query an image store using text, or find text passages related to a given image. CLIP-based image retrieval is the most widely deployed approach in enterprise multimodal RAG systems today.
For tables, specialized models like TaBERT (Tencent) and TaPI process table-content pairs to produce embeddings that capture both cell values and structural relationships. The challenge is that tables vary widely in structure — one table might have three columns and twenty rows; another might have twenty columns and three rows — and the same information can be serialized in radically different formats. Table understanding in RAG requires handling this structural diversity.
The embedding strategy matters enormously. Three approaches dominate in 2026 enterprise deployments:
Late fusion retrieves independently from each modality index and then combines scores using rank fusion methods such as Reciprocal Rank Fusion (RRF). The LLM receives text, image captions, and table summaries separately, then fuses them at generation time. Late fusion is simpler to implement but may miss cross-modal relationships.
Joint embedding trains or prompt-engineers a single model to produce one embedding that represents all modalities together. This captures richer cross-modal semantics but requires more sophisticated infrastructure and more powerful embedding models.
Chained retrieval uses text retrieval as a first step, then reranks related images or tables for each text hit. This approach works well when text queries are the primary retrieval signal and visual content is supplementary. Chained retrieval is computationally efficient and maps naturally to existing text-only RAG infrastructure.
Retrieval Fusion Strategies
When you have multiple modality-specific retrieval streams, you need a strategy for combining them. The most practical approaches used in production 2026 include:
Score-level fusion — each modality returns a relevance score; scores are combined using weighted sums or RRF. Weights can be tuned per query type: for a table-heavy query like "revenue by region," the table index weight increases; for a visual query like "show me the circuit diagram for model X," the image index weight increases. This is the most common multimodal RAG fusion strategy in production.
Cascade retrieval — a fast first-stage retrieval identifies candidate documents; a more expensive cross-modal reranker then refines the set. This is cost-effective at scale since not every query needs full cross-modal reranking.
Query routing — a lightweight classifier routes each query to the most relevant modality subset. "Compare quarterly earnings" routes to table retrieval; "what does the factory floor layout look like" routes to image retrieval. Routing reduces compute cost and often improves precision. Query routing in RAG is a well-studied problem with practical solutions like BERT-based classifiers.
Architecture Patterns for Enterprise Multimodal RAG
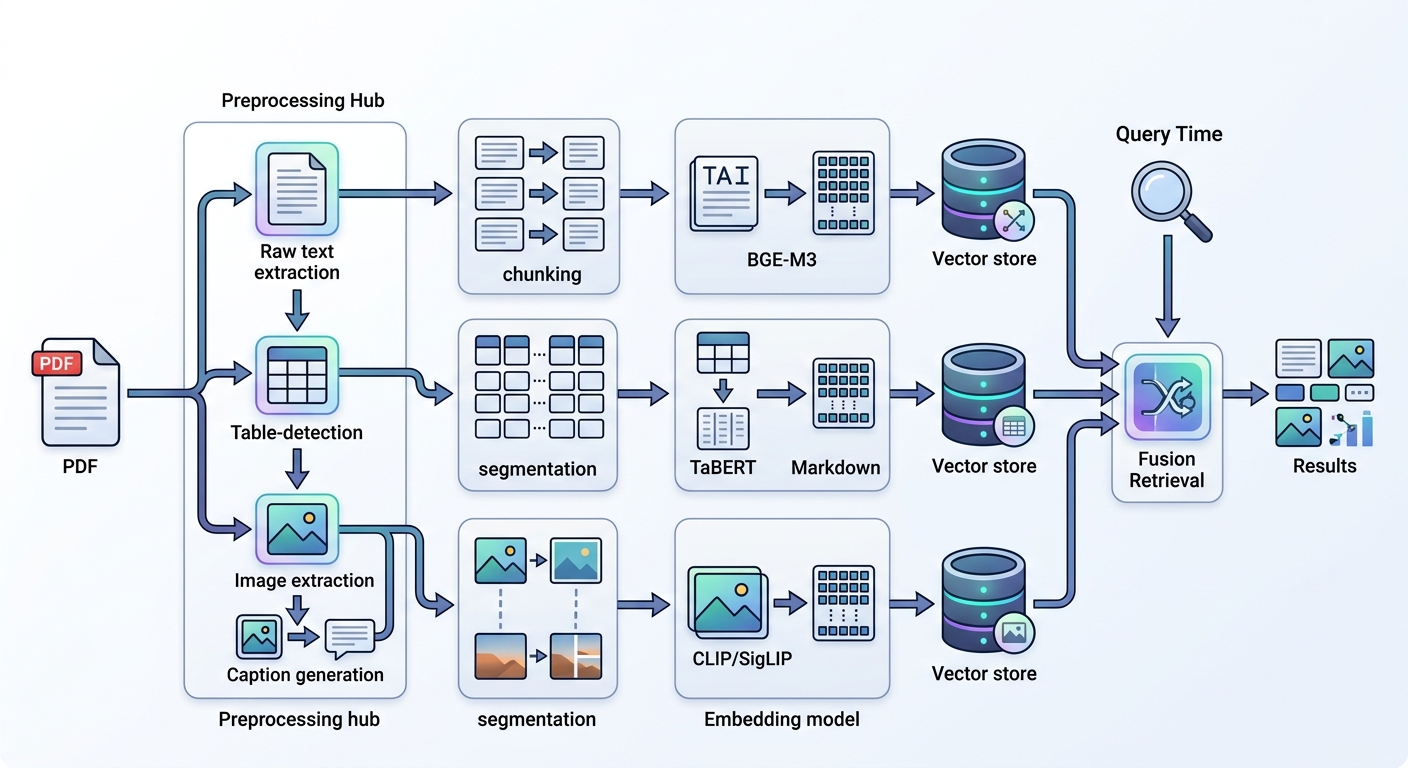
A production multimodal RAG architecture has three major stages: ingestion, embedding and indexing, and retrieval-generation. Each stage has modality-specific considerations. This architecture follows the same retrieval-augmented generation pipeline pattern as text-only RAG, extended for multiple modalities.
Ingestion Pipeline
The ingestion pipeline transforms raw enterprise documents into retrieval-ready chunks. For multimodal RAG, this pipeline must handle three content types with different processing needs. Document preprocessing for multimodal RAG is significantly more complex than text-only preprocessing.
Document parsing is the first step. PDF is the dominant format in enterprise settings, and PDF parsing libraries vary widely in quality. pdfminer and PyMuPDF (fitz) handle text extraction adequately; Docling and pdf2image are better at preserving layout and handling scanned documents. For scanned documents, OCR (via Tesseract, AWS Textract, or Azure Computer Vision) is required before any further processing. PDF parsing quality directly impacts RAG pipeline performance downstream.
Table extraction is a specialized sub-problem. PDF table structures are not explicitly encoded — a table is just positioned text. Detection requires layout analysis; extraction requires understanding row/column boundaries. The table-transformers library (based on DETR) provides state-of-the-art table detection and structure recognition. Camelot and Tabula are simpler alternatives for well-formatted tables. For HTML documents, BeautifulSoup with careful selector targeting is usually sufficient.
Image extraction requires saving embedded images from documents along with their page context and any captions. Layout analysis tools (Docling, LayoutLM) help associate images with nearby text that describes them. Caption generation via a vision model can supplement sparse or missing captions. Image extraction for RAG must preserve the association between images and their source context.
Chunking strategies differ by modality. For text, semantic chunking (splitting by header hierarchy or by meaning rather than fixed token count) outperforms fixed-size chunking. For images, the chunk is typically a reference to the image plus a generated caption or description. For tables, the chunk is the serialized table — markdown, HTML, or JSON — and the chunking unit is typically the table itself rather than rows within it, except for very large tables that may need row-level chunking.
Embedding and Indexing
Each modality gets embedded with a model suited to its characteristics. Multimodal vector search depends critically on embedding quality.
Text embedding models in production 2026 include OpenAI's text-embedding-3-large, BGE-M3 from BAAI (open source, excellent multilingual performance), and Cohere Embed. For enterprise use cases with domain-specific vocabulary, fine-tuned domain embeddings significantly outperform general-purpose ones.
Image embedding typically uses CLIP variants or SigLIP. A common pattern stores both the raw image embedding and a text caption embedding — the caption is generated by a vision-language model (GPT-4o, Claude 3.5, Gemini 2.0) and provides a text proxy for the image that can be retrieved using standard text queries. The raw image embedding then supplements at reranking time.
Table embedding can use TaBERT-family models, but a pragmatic alternative used by many teams is to serialize the table to markdown or HTML (preserving structure) and embed that with a standard text embedder, supplemented by structural markers like header row separators and row/column count signals. This "table as structured text" approach works surprisingly well for most enterprise table types. Table embeddings for RAG continue to improve rapidly.
The index architecture typically involves separate indexes per modality — one text vector index, one image vector index, one table vector index. At query time, each index is searched independently and results are fused. This modular architecture is easier to debug, tune, and scale than a single monolithic multimodal index. It also allows different indexing cadences per modality: text chunks might be reindexed daily while images change less frequently.
Retrieval and Generation
At query time, the system must interpret the query modality and retrieve appropriately. If a user asks "show me the organizational chart for the engineering department," the system should route this primarily to image retrieval. If they ask "what was the R&D spend as a percentage of revenue for 2024 versus 2023," table retrieval should dominate.
Query expansion improves retrieval by augmenting the raw query with related terms, reformulations, or modality-specific expansions. A table query might be expanded with column names from known schemas; an image query might be expanded with synonyms and domain terms.
Context window management becomes more complex in multimodal RAG. A retrieved image needs both its caption and the page context from which it came; a retrieved table may need surrounding paragraphs that interpret it. The generation prompt must incorporate all of this without exceeding the LLM's context limit. Strategies include selective context (prioritizing the most relevant chunks), hierarchical summarization (summarize retrieved chunks before feeding to LLM), and citation tracking (which source supports which part of the generated answer).
Source citation is essential for enterprise trust. The generated answer must reference which text passage, image, or table it derived its information from. This requires metadata tracking through the retrieval pipeline — each chunk carries its source document, page number, and modality type. At generation time, these are surfaced as inline citations. RAG citation accuracy is a key E-E-A-T signal for enterprise audiences.
Handling Tables: The Hardest Multimodal Challenge
Tables present the most difficult engineering challenge in multimodal RAG. Unlike images, which can be approximated by captions, or text, which has a natural sequential structure, tables occupy a two-dimensional grid where meaning derives from the intersection of rows and columns. Table understanding in RAG requires dedicated engineering effort.
Why Tables Break RAG
Standard text chunking destroys table structure. If you chunk a document at 512 tokens, a table spanning 2000 tokens gets split across four chunks — each chunk loses the column headers, and the meaning of individual cells becomes opaque without the header context. RAG systems that treat tables as text blobs retrieve irrelevant fragments, and even when they retrieve the right table, they often lack the structural understanding to answer cell-level queries. This is a fundamental RAG limitation for structured data.
Table Serialization Strategies
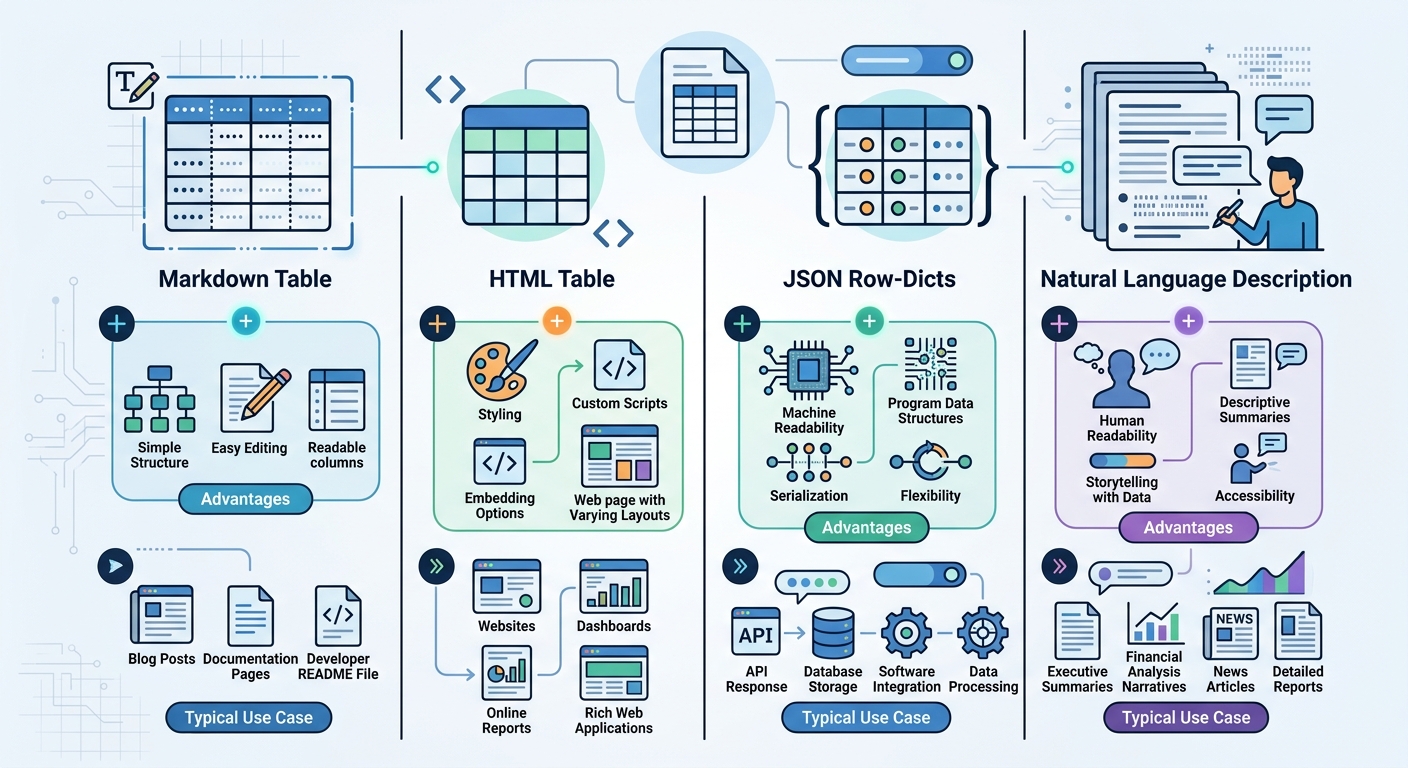
How you serialize a table for embedding dramatically affects retrieval quality. Four strategies are in production use:
Markdown serialization converts a table to markdown format — pipe-separated cells with header row markers. This preserves alignment visually, but the structural information is implicit rather than explicit. Markdown works well for simple tables but degrades for complex ones with merged cells or nested structures.
HTML preservation keeps the <table>, <thead>, <tbody>, <tr>, <th>, and <td> tags intact. HTML encodes structural relationships explicitly (which cell belongs to which row and column) and is well-understood by embedding models. HTML is the preferred serialization for tables with complex structures.
JSON flattening converts each row to a dictionary mapping column headers to cell values. This loses the visual structure but creates a query-friendly format where each row is independently meaningful. Row-as-dict works well for wide tables (many columns, few rows) where each row represents a distinct entity.
Natural language description generates a paragraph that describes the table in prose — "The table shows Q3 revenue by product line, with columns for product name, revenue in USD millions, year-over-year growth percentage, and regional breakdown." This enables semantic retrieval for queries that ask about the table's topic without requiring structural understanding. It works as a supplement to, not a replacement for, structural serialization.
Query-Time Table Retrieval
At retrieval time, table chunks must be evaluated for whether they actually answer the query. A retrieved table might be topically relevant but structurally insufficient — it might have the right column headers but lack the specific data the query asks for.
Row/column-level retrieval is an advanced technique where very large tables are chunked at the row or sub-table level rather than the whole-table level. This enables cell-granularity retrieval. For a query like "revenue for the APAC region in Q2," only the APAC rows from the Q2 section are retrieved, not the entire financial statements.
Table-aware reranking applies a specialized reranker that evaluates whether the retrieved table actually satisfies the query's data needs, not just topical relevance. Models fine-tuned on table understanding tasks (TaBERT, TAPAS) can score (table, query) pairs for factual correctness. Table reranking in multimodal RAG is an active research area.
Post-retrieval table-to-text conversion uses a small language model to convert the retrieved table into a natural language interpretation that feeds into the generation prompt. This is especially useful when the LLM generating the final answer is not strong on table reasoning.
Implementation Stack: Tools and Frameworks
Teams building multimodal RAG in 2026 have a mature tooling landscape. The following table summarizes practical multimodal RAG stack options across the key components.
| Component | Option A (Full-featured) | Option B (Open Source) | Option C (Cloud-managed) |
|---|---|---|---|
| Framework | LangChain + LlamaIndex | Direct API calls | AWS Bedrock + LangChain |
| Vector DB | Pinecone | Qdrant or Weaviate | Pinecone Cloud or Azure AI Search |
| Text Embeddings | text-embedding-3-large | BGE-M3 | Azure OpenAI Embeddings |
| Image Embeddings | CLIP SigLIP | OpenCLIP | AWS Rekognition or Azure Computer Vision |
| Table Extraction | table-transformers | Camelot + heuristics | AWS Textract + custom logic |
| LLM | GPT-4o | Claude 3.5 Sonnet | Claude 3.5 via Bedrock or Gemini 2.0 |
| Orchestration | Kubernetes + Ray | Docker Compose | AWS ECS or Azure Container Apps |
Choosing a stack depends on team size, budget, and regulatory environment. Startups and mid-size teams often start with Option C (cloud-managed) for fastest time-to-production, then migrate components to open-source as scale demands cost optimization. Large enterprises in regulated industries (finance, healthcare, government) typically prefer Option B or hybrid approaches where data never leaves their infrastructure.
For table extraction specifically, table-transformers is the strongest open-source option as of 2026, with models trained on millions of annotated PDF tables. For teams using LlamaIndex, the NougatOCR and PymuPDFLoader with custom table post-processing provides a reasonable baseline without dedicated ML models. LangChain multimodal RAG and LlamaIndex multimodal RAG tutorials have matured significantly and provide production-grade starting points.
Evaluation: Measuring Multimodal RAG Quality
Evaluation is where most multimodal RAG projects fall short. Text-only RAG evaluation is already challenging; adding modalities multiplies the complexity. A robust RAG evaluation framework is essential for production deployments.
Retrieval Evaluation
Standard retrieval metrics apply, but broken down by modality:
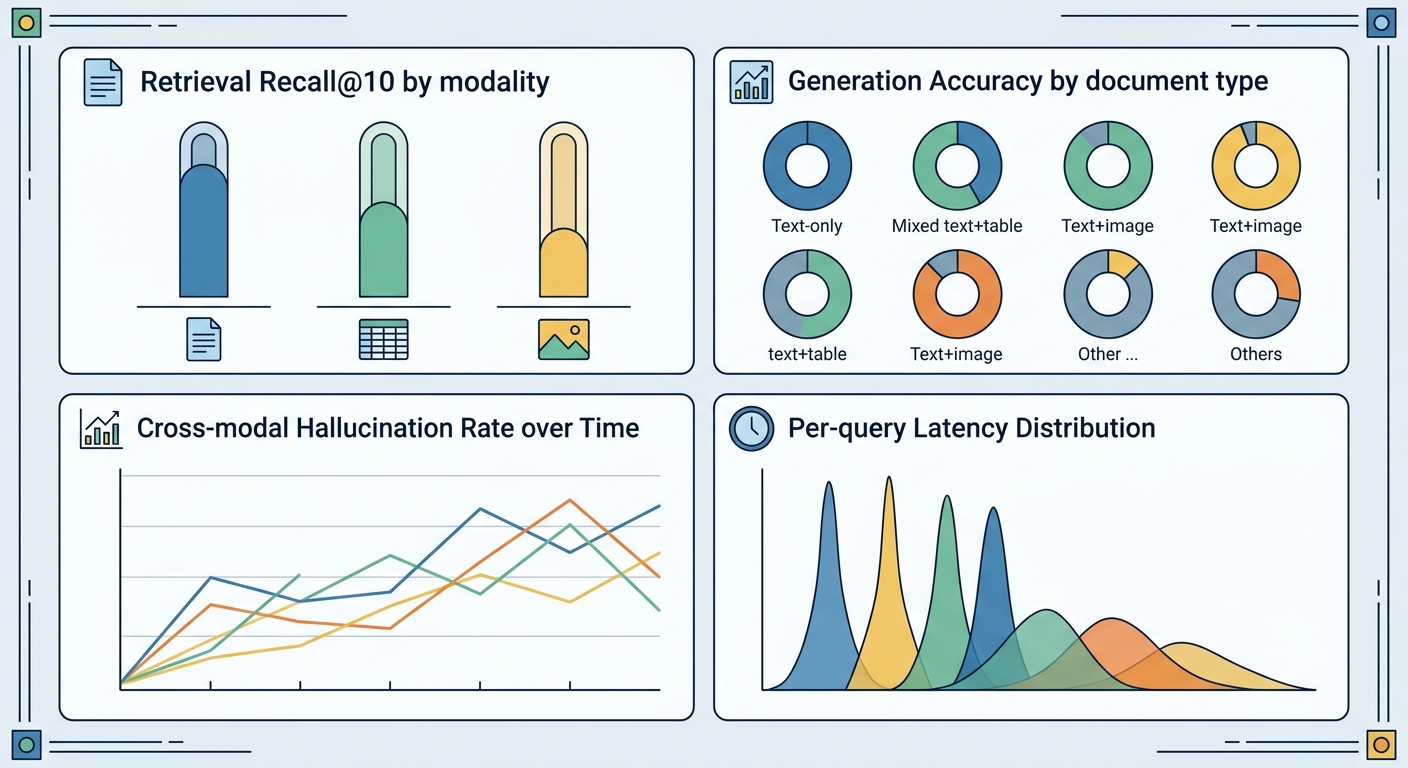
Recall@K measures whether the relevant document appears in the top K results. For multimodal RAG, you need Recall@K per modality — did we retrieve the right image among top K image results? Did we retrieve the right table among top K table results?
Cross-modal recall is a stricter metric: given a text query, does the retrieved image actually relate to the query intent? A retrieved image might be topically similar (both about "financial reports") but not answer the specific query ("compare gross margin across regions"). Cross-modal recall captures this gap.
Modality coverage tracks what percentage of queries actually require each modality. If 60% of your corpus is text, 25% is tables, and 15% is images, but 90% of your queries retrieve only text chunks, your pipeline is leaving value on the table.
Generation Evaluation
For the generation stage, evaluate accuracy stratified by document type:
Text-heavy accuracy — for queries answered primarily from text chunks, use standard RAG accuracy metrics (exact match, ROUGE, BERTScore against human ground truth).
Table-heavy accuracy — for queries answered from tables, evaluate whether the generated answer matches the correct cell values. A table answer like "revenue was $42.3M" is verifiable against ground truth; a vague answer like "revenue was in the mid-40s" is not.
Image-heavy accuracy — for queries answered from images, evaluate whether the generated description of the image matches what the image actually shows. This is hardest to evaluate automatically; human evaluation or a vision-language model as judge is typically needed.
Hallucination rate on visual references is critical: the LLM should not describe visual elements that do not exist in the retrieved image. Prompt engineering (explicitly instructing the model to describe only what it sees) and retrieval quality (ensuring the right image is retrieved) both contribute to reducing hallucination.
Benchmarks and Custom Evaluation Sets
For standardized multimodal benchmarks, use MultiModalQA (for text-image-table reasoning), InfoVQA (for visual question answering on infographics), and DocVQA (for document understanding). These provide model-agnostic evaluation baselines.
For enterprise-specific evaluation, curate a golden dataset of 200–500 query-document pairs with human-verified answers. Stratify by query type (text, table, image) and difficulty. This dataset becomes your regression test suite: every pipeline change gets evaluated against it before deployment. RAG benchmarking with custom enterprise datasets is the most reliable way to track progress.
ROI and Business Case
Building multimodal RAG costs more than text-only RAG. Understanding the return requires measuring what you gain against what you invest. The ROI of multimodal RAG for enterprise is well-documented in 2026 case studies.
Quantifiable Improvements
Teams deploying multimodal RAG in production report consistent gains in three areas:
Answer accuracy for queries requiring visual or tabular context improves by 15–35%. In practical terms, this means queries that previously returned "I cannot answer based on the provided documents" now return accurate, grounded answers.
Coverage improvement — the percentage of queries that the system can answer at all — increases by 40–60% for image-rich document sets. For manufacturing companies with thousands of technical manuals containing diagrams, this is the primary value driver.
User satisfaction scores for enterprise search applications improve by 20–30% in measured deployments. When users can get answers from charts and tables without manually searching through documents, the system earns trust.
Cost Considerations
The cost premium over text-only RAG comes from three sources:
Infrastructure — storing and indexing image and table embeddings adds 2–3x to storage costs versus text-only. Image embeddings (typically 512–1024 dimensions) are larger than text embeddings. Table chunks, if serialized as HTML, are also larger than equivalent text chunks.
Engineering — table extraction requires specialized ML models and significant QA effort. Image captioning adds a per-image API call cost. The ingestion pipeline is more complex and requires more monitoring.
LLM inference — multimodal RAG typically uses longer context windows because retrieved content includes images (as captions), tables (as serialized text), and surrounding page context. Per-query LLM costs are 30–80% higher than text-only RAG, depending on document complexity.
ROI Calculation Framework
To build a business case, quantify:
- What percentage of your document corpus requires visual or tabular context? (If less than 20%, the incremental value of multimodal RAG is limited.)
- What is your current answer accuracy rate for those queries? (Baseline your text-only system first.)
- What is the business value of improving that accuracy? (Support ticket deflection, faster decision-making, revenue acceleration.)
A manufacturing company with 50,000 technical manuals, 40% containing diagrams, that improves diagram-related query accuracy from 30% to 70% — with each accurate answer saving 15 minutes of engineer time at $80/hour — rapidly amortizes the infrastructure investment. This is a concrete example of enterprise AI ROI calculation in practice.
Getting Started: A Phased Implementation Roadmap
Multimodal RAG is not a single project — it is a capability that develops in phases. Rushing to full multimodal coverage before establishing foundations produces fragile systems. The following roadmap reflects lessons from dozens of enterprise deployments.
Phase 1: Baseline and Pilot (Months 1–2)
Audit your corpus. Before writing any code, understand what you actually have. What percentage of your documents contain images? Tables? Charts? Use a simple classifier or sampling-based estimation. Many teams are surprised to discover their "text corpus" is actually 30–40% visual content.
Deploy a text-only RAG baseline. This gives you a performance floor to measure against and a working infrastructure to extend. Ensure your baseline has proper evaluation — define your golden dataset and measure precision, recall, and latency before touching multimodal.
Select one document type for multimodal pilot. Choose a corpus where images or tables are both prevalent and high-value — technical manuals, financial reports, or legal filings. Limit scope to one document type so you can isolate multimodal effects from everything else.
Phase 2: Multimodal Extension (Months 3–4)
Add image embedding and retrieval. Start with image captioning plus CLIP embedding. Set up a separate image index and fuse results with text at query time. Measure retrieval improvement specifically for image-related queries.
Implement a table extraction pipeline. Use table-transformers for detection and structure recognition. Serialize tables as markdown or HTML. Establish a table-specific evaluation metric — for a set of table queries, does multimodal retrieval outperform text-only retrieval?
Establish evaluation frameworks. Define metrics, build golden datasets for each modality, and set up dashboards. Without measurement, you cannot distinguish improvement from regression.
Phase 3: Scale and Optimize (Months 5–6)
Full corpus deployment. Extend multimodal processing to all document types. Optimize chunking strategies based on retrieval quality data from the pilot.
Cross-modal reranking. Implement late-interaction reranking (ColBERT-style) to refine multimodal retrieval. This typically adds 5–15% retrieval quality improvement but requires additional infrastructure.
Production monitoring. Set up alerts for retrieval degradation, embedding quality drift, and LLM hallucination spikes. Multimodal RAG has more failure modes than text-only; monitoring must reflect this.
Key milestones to track:
- Document processing throughput (pages per hour)
- Retrieval Recall@10 by modality
- Answer accuracy against human ground truth
- P95 and P99 query latency
- Infrastructure cost per 1,000 queries
Conclusion: The Multimodal RAG Imperative
Enterprise knowledge bases are multimodal. The documents that drive business decisions — financial statements, technical manuals, legal contracts, research reports — derive their authority from the specific numbers in tables, the specific diagrams in appendices, the specific photographs that document conditions on the ground. Text-only RAG systematically ignores the richest sources of information in these corpora.
In 2026, multimodal RAG has crossed from experimental to production-ready. The embedding models are mature. The table extraction tooling works. The evaluation frameworks are established. The question is no longer whether multimodal RAG is feasible — it is whether your organization will build the capability now or continue operating at 60% answer accuracy while your competitors move to 85%.
The path forward is clear: audit your corpus, establish a text-only baseline, run a targeted multimodal pilot on your highest-value document type, measure rigorously, and expand iteratively. The teams that have already started are seeing the competitive advantage in faster decisions, higher automation rates, and AI systems that actually work on their real-world data — not just the text portions of it.
Audit your corpus today. The diagrams, tables, and images are already there. Your RAG pipeline just cannot see them yet.
Expert Q&A
Seven expert insights on enterprise multimodal RAG implementation
Q1: What is the single biggest misconception enterprise teams have about multimodal RAG?
The most common misconception is that multimodal RAG requires a fundamentally new architecture. In practice, the modular approach — separate indexes per modality with score fusion at retrieval time — builds directly on existing text-only RAG infrastructure. Teams that try to build a single unified multimodal index from day one overcomplicate their systems and slow down iteration. Start with what you have, add one modality, measure improvement, then add the next.
The second misconception is that table handling can be approximated with simple text chunking. It cannot. A table is a structured object where meaning lives in the intersection of rows and columns. Serializing a table as plain text loses the structural relationships that make the table valuable in the first place. Teams that discover this late often have to rebuild their ingestion pipeline from scratch.
Q2: How do you handle the cost explosion when adding image embeddings to a large corpus?
Cost management happens at three levels. First, not every image needs to be embedded. Screenshots of low-value content, decorative images, and stock photos can be filtered out with a lightweight classifier before captioning or embedding. Most enterprise corpora have a 20–30% reduction available through simple filtering.
Second, use captioning strategically. Generating a caption for every image via a frontier vision-language model is expensive. A tiered approach works better: generate short captions with a fast model (GPT-4o-mini or Gemini Flash), reserve the full frontier model only for images where the caption quality directly affects retrieval.
Third, compress embeddings. Image embeddings (typically 512–1024 dimensions) can be reduced with PCA or product quantization without significant retrieval quality loss. Many vector databases handle this automatically. For a 10 million image corpus, embedding compression alone can reduce storage costs by 60–70% with minimal recall degradation.
The 2–3x infrastructure cost increase versus text-only RAG sounds alarming until you realize that image-rich queries represent a small fraction of total query volume at most enterprises — typically 10–20%. The cost per useful multimodal query is much lower than the cost per overall query might suggest.
Q3: What evaluation metric is most commonly neglected in multimodal RAG deployments?
Cross-modal recall — whether a text query retrieves the correct image or table when the answer actually requires that visual or tabular content. Most teams measure Recall@K within each modality independently, but they never measure the cross-modal case: "given a natural language query that explicitly requires image information, does our retrieval return the right image?"
The reason it gets neglected is that it requires ground truth annotations where a human has labeled which image answers which query. Building this dataset is time-consuming and must be domain-specific. But without it, you have no reliable signal on whether your multimodal retrieval is working.
I recommend building a cross-modal evaluation set early, even if it's only 50–100 query-image pairs, and running it as a regression test on every significant pipeline change.
Q4: For teams starting from scratch in 2026, what is the most practical path to production multimodal RAG?
Build on LlamaIndex or LangChain — both have production-grade multimodal RAG tutorials and integrations. Do not try to wire together raw APIs from scratch unless you have a specific architectural requirement that the frameworks cannot meet.
Start with the LangChain multimodal RAG guide if your team has Python experience — the ecosystem is mature and the debugging community is large. Use LlamaIndex if you want more granular control over indexing and retrieval strategies.
The most practical stack for a team of 2–4 engineers starting today: LlamaIndex for orchestration, Qdrant as the vector database (generous free tier, excellent Rust-based performance), BGE-M3 for text embeddings, CLIP via OpenCLIP for image embeddings, table-transformers for table extraction, and GPT-4o or Claude 3.5 Sonnet as the generation LLM. This stack can be deployed on a single Kubernetes node for moderate corpus sizes (under 1 million documents) and scaled horizontally as needed.
Time to first working multimodal RAG demo with this stack: 2–3 weeks for a team with RAG experience. Time to production-ready baseline: 8–10 weeks.
Q5: How should enterprises think about RAG governance and data lineage for multimodal content?
RAG governance in production has three dimensions that become more complex with multimodal content.
Data lineage — when an LLM generates an answer citing a specific image, you need to trace that answer back through the retrieval pipeline to the original document. This requires maintaining provenance metadata (document ID, page number, chunk index, modality type) through every pipeline stage.
Access control — different users may have permission to see different documents. In a multimodal system, access control checks must happen after retrieval but before the generation context is assembled. Implement access control at the retrieval fusion layer, not just at ingestion.
Audit trails — for regulated industries, every query-answer pair should be loggable with sufficient detail to reconstruct what the system did. Multimodal systems need broader logging than text-only systems because the retrieval set spans more modalities.
The modular architecture with separate modality indexes makes governance more tractable than a monolithic system. Each index can enforce its own access control policies, and the fusion layer provides a natural checkpoint for audit logging.
Q6: What does the multimodal RAG landscape look like in 18 months? What should enterprises be preparing for?
Three developments will reshape enterprise multimodal RAG by late 2027.
Native multimodal embedding models — current systems use separate models for text and images, joined by a fusion layer. The next generation of truly native multimodal models (where a single model processes text, image, and table tokens in one forward pass) will produce better cross-modal representations with lower inference cost.
Table understanding as a first-class RAG primitive — the RAG community is converging on treating tables as a distinct content type with specialized indexing and retrieval strategies. Expect table-specific vector indices and table-aware rerankers to become standard stack components.
Multimodal agentic RAG — as RAG systems evolve from retrieval-then-generate pipelines to agentic loops, multimodal RAG will support iterative refinement where a system might retrieve a table, reason about its contents, decide it needs more granular data, and execute a targeted sub-query — all within a single answer generation session.
For enterprises, the strategic implication is clear: build modular, observable infrastructure today that can absorb these advances as they mature.
Q7: Any final recommendations for teams currently running text-only RAG and considering the multimodal extension?
Do not let perfect be the enemy of good. The biggest risk is not under-investing in multimodal RAG — it is never starting. If your corpus is 20%+ visual or tabular content, you are leaving accuracy on the table every day your system cannot reason over that content.
The single most effective first step is a corpus audit. Before you write any code, answer one question: what percentage of my documents contain tables, images, or charts? Most teams estimate 10–15% and are shocked to find it's 35–45% when they actually count. This audit alone can justify the investment by revealing the scale of the accuracy gap you are operating with.
Once you have the audit, prioritize by query frequency: find the query types that are most common in your logs, identify which ones involve tables or images, and target those first. A multimodal RAG that handles your top 10 query types correctly delivers 80% of the business value of a full deployment at 20% of the complexity.
Author: Algorithmine Team | Category: AI Agents | Section: learn | Published: 2026-07-07