Evaluation-Driven Data Flywheels: Building the Feedback Loops That Make LLM Products Smarter Over Time
How evaluation-driven data flywheels turn user feedback into smarter LLM products. Build trustworthy evals, calibrate LLM judges, and close the loop.
A static LLM product degrades after launch. Real traffic shifts. New edge cases appear that nobody tested. Many teams cannot tell whether their product is getting better or worse.
The fix is a feedback loop that compounds. We call it an evaluation-driven data flywheel. It turns every user interaction into data that makes the product smarter over time.
This guide explains the full loop. You will learn the four stages, how to build trustworthy evals, and how to avoid common failure modes. These patterns come from shipping LLM products in production, where evals decide what reaches users. By the end, you will have a blueprint you can ship this month.
Why Static LLM Products Deteriorate
Your model was perfect in testing. Then it hit production, and reality intervened.
Users phrase questions differently than your test set. New topics appear that your retrieval index never saw. The tone of your user base drifts as your product grows. Each of these is a form of distribution shift.
Model drift describes the slow decline in accuracy as inputs change. It is not your fault. It is physics. The world your model trained on is no longer the world it serves. Ticketing data changes, product catalogs rotate, and support queries evolve seasonally.
The deeper problem is measurement. Without feedback, you cannot tell if changes help or hurt. You tune a prompt blindly. You hope for the best. This is how LLM products quietly rot.
An evaluation-driven data flywheel solves the measurement problem first. It gives you a north star metric. Then it feeds improvement.
The core insight is simple: you cannot improve what you cannot measure. The flywheel exists to measure continuously.
The Four Stages of the Evaluation-Driven Data Flywheel
The flywheel is a closed loop with four stages. Each stage feeds the next.
Stage 1 — Generate. Your product answers real user requests. This is the raw voice of demand. Every answer is a potential learning signal, not just a served response.
Stage 2 — Capture. You collect feedback on those answers. Feedback can be explicit, like a thumbs-down. It can also be implicit, like a user editing the output or abandoning the session.
Stage 3 — Evaluate. You score the captured interactions. Automated judges, human reviewers, and metric suites produce a quality signal. This is where the loop earns or loses trust.
Stage 4 — Refine. You use that signal to improve prompts, retrieval, or the model itself. The improved product generates better answers, and the loop restarts.
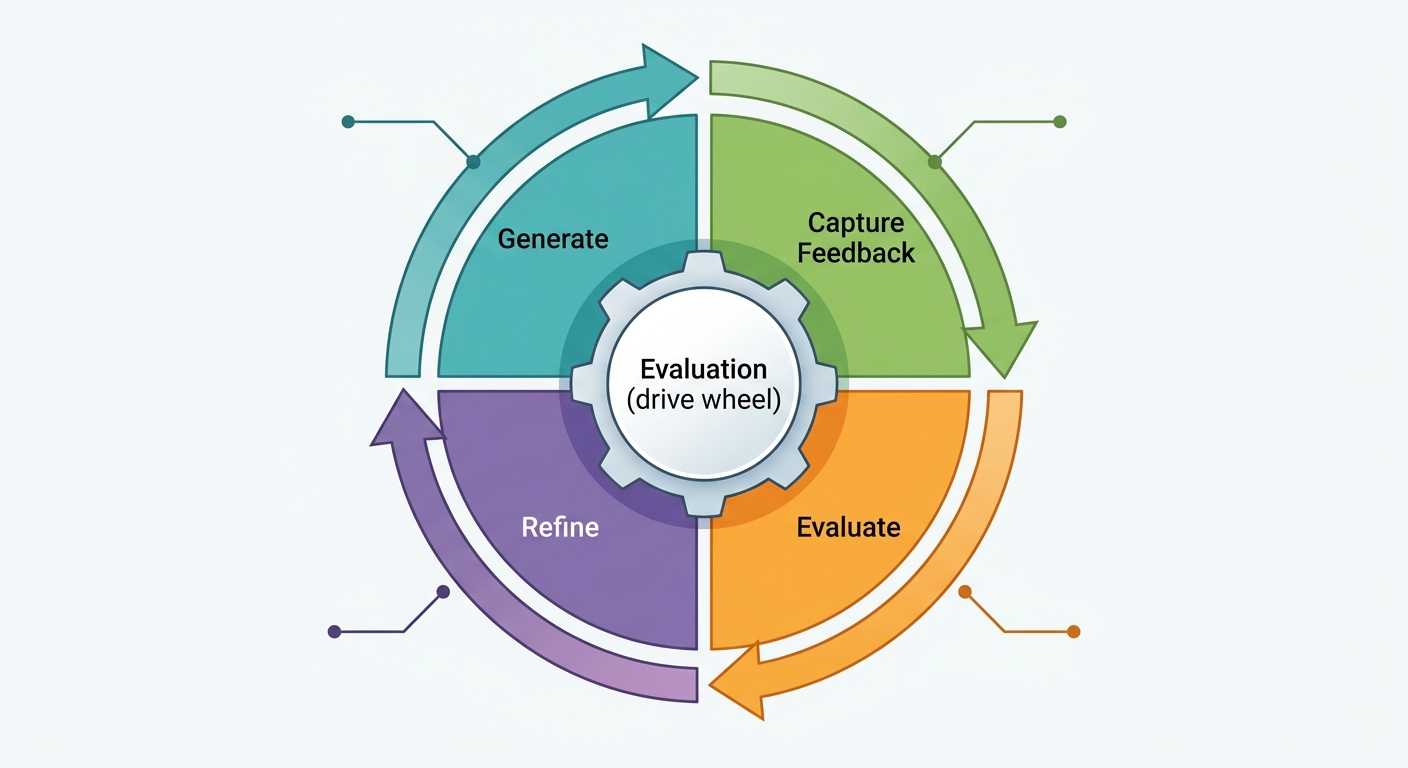
The critical design choice is emphasis. Most teams treat the flywheel as a data collection problem. They assume more feedback equals a better model. That is false.
The drive wheel is evaluation. If your scoring is biased or noisy, your feedback becomes garbage. You refine against a broken signal and make things worse. Teams that skim this step usually discover the mistake after a costly regression.
Build evaluation first. Make it trustworthy before you trust the loop.
The Drive Wheel: Building an Eval Suite You Can Trust
Public benchmarks are seductive. They produce clean leaderboard numbers. They are almost useless for your product.
A benchmark tests what is easy to measure. It does not test your users, your domain, or your edge cases. A great MMLU score tells you nothing about your customer-support bot.
You need product-specific evals. Build them from real traffic.
Start with task-specific golden sets. A golden set is a small, hand-labeled collection of input-output pairs. Each pair encodes what a correct answer looks like for your product. Label them with domain experts who know your ground truth.
Run every candidate change against the golden set. This is your regression suite. It catches small breakages before they reach users. It is the minimum bar every release must clear.
Add a frontier suite for exploration. This is a broader, less stable set that probes new behaviors. It grows as you learn about your product. Keep the two suites separate so regressions never hide in noise.
Wire eval gates into your CI/CD pipeline. An eval gate blocks a deployment unless the candidate beats the current version on key metrics. This is the practice called eval-driven development.
Eval gates turn "we hope this is better" into "we measured that it is." They are the escape hatch from blind tuning.
Using an LLM as a Judge — With Your Eyes Open
Human evaluation is expensive and slow. You cannot hand-label every prompt. This is where LLM-as-a-judge comes in.
An LLM judge scores outputs automatically. It can rank two answers or assign a quality grade. Modern judges agree with human experts about 85 percent of the time. That is close to the agreement rate between two human raters.
That sounds great. The caveats are real.
Position bias. A judge may favor whichever answer appears first. Always randomize order before comparing.
Verbosity bias. Judges often prefer longer answers, even when shorter ones are better. Control for length in your rubric.
Self-preference bias. A judge may favor outputs from models in its own family. Mix judge models to avoid overfitting.
These biases are manageable if you calibrate. Calibration aligns the judge with human judgment.
Sample a slice of production interactions. Have several human experts score them with the same rubric. Compare human labels to judge labels. Find where they disagree.
Then fix the rubric. Add clearer criteria and worked examples. These anchor examples teach the judge what humans value.
Re-run this calibration on a rolling basis. Production changes over time, so judge alignment drifts. One-time calibration is not enough.
An uncalibrated judge is worse than no judge. It gives you false confidence and poisons every downstream decision.
Capturing Real Feedback Without Ruining the UX
The second stage is capture. This is where most products fail by asking too much.
A modal that demands a five-star rating after every answer will drive users away. Design for low friction.
Explicit feedback. Thumbs up and down. A "report a problem" button. These are easy and honest. Keep them one tap.
Implicit feedback. Users vote with behavior. They copy an answer, which signals usefulness. They edit it, which signals a flaw. They ask a follow-up, which signals curiosity. They abandon the session, which signals frustration.
Implicit signals are the richest source of data. They require no user effort. You just have to log them.
Log the full context, not just the verdict. Capture the prompt, the retrieval sources, the answer, and the user action. Context is what makes the feedback interpretable.
Also treat guardrail outputs as feedback. When a safety filter blocks a response, that is a datapoint. It tells you where the product is near a boundary.
The goal of capture is context. A thumbs-down with no surrounding detail is a puzzle, not a signal.
Refining the System: From Feedback to Better Outputs
The final stage closes the loop. Refinement has a recommended order of operations.
Start with prompts. Prompt tuning is cheap and fast. It fixes many surface issues without new infrastructure.
Update retrieval. If you use RAG, check the retrieval layer. A bad index produces bad answers no matter how good the model is. Measure retrieval health separately from generation quality.
Then fine-tune. Fine-tuning adapts the model to your domain. It is powerful and dangerous. Use it only when prompts and retrieval are not enough.
Track regression explicitly. A fine-tune can fix one class of errors and break another. This is catastrophic forgetting, and it is silent unless you measure it.
Watch for reward hacking. This happens when the model learns to game the metric while failing your real goal. It may produce polished but useless answers that score well on a narrow rubric.
Guard against reward hacking with diverse feedback. Mix automated scores, human review, and real outcome data. A narrow reward is a hacking invite.
Synthetic data fits here too. You can use your best outputs to generate training examples. Then a smaller student model learns from the large teacher. This is distillation, and it cuts cost dramatically while staying accurate.
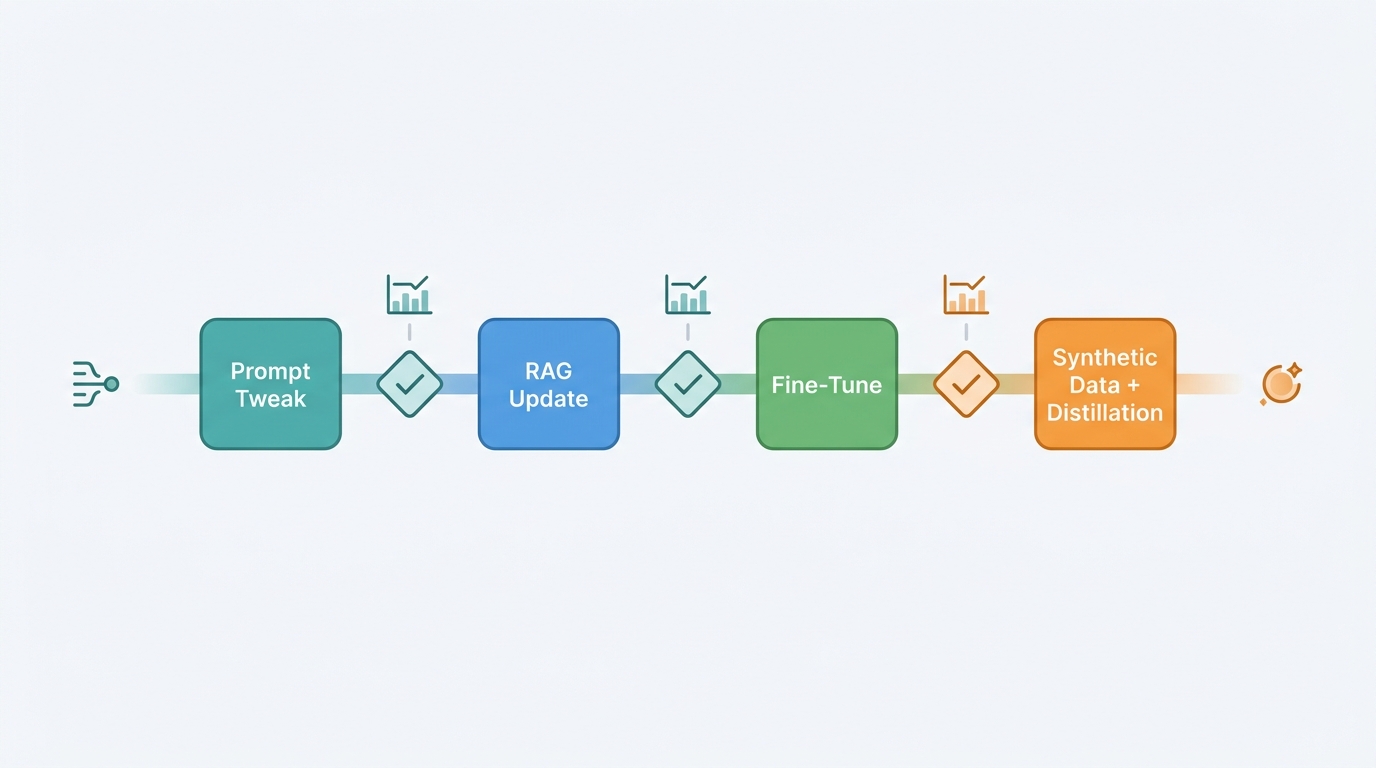
Follow the ladder in order: prompts, retrieval, then the model. Each rung is gated. Never fine-tune because you were too lazy to fix a prompt.
A Minimal Reference Architecture
Now let us wire the whole system together.
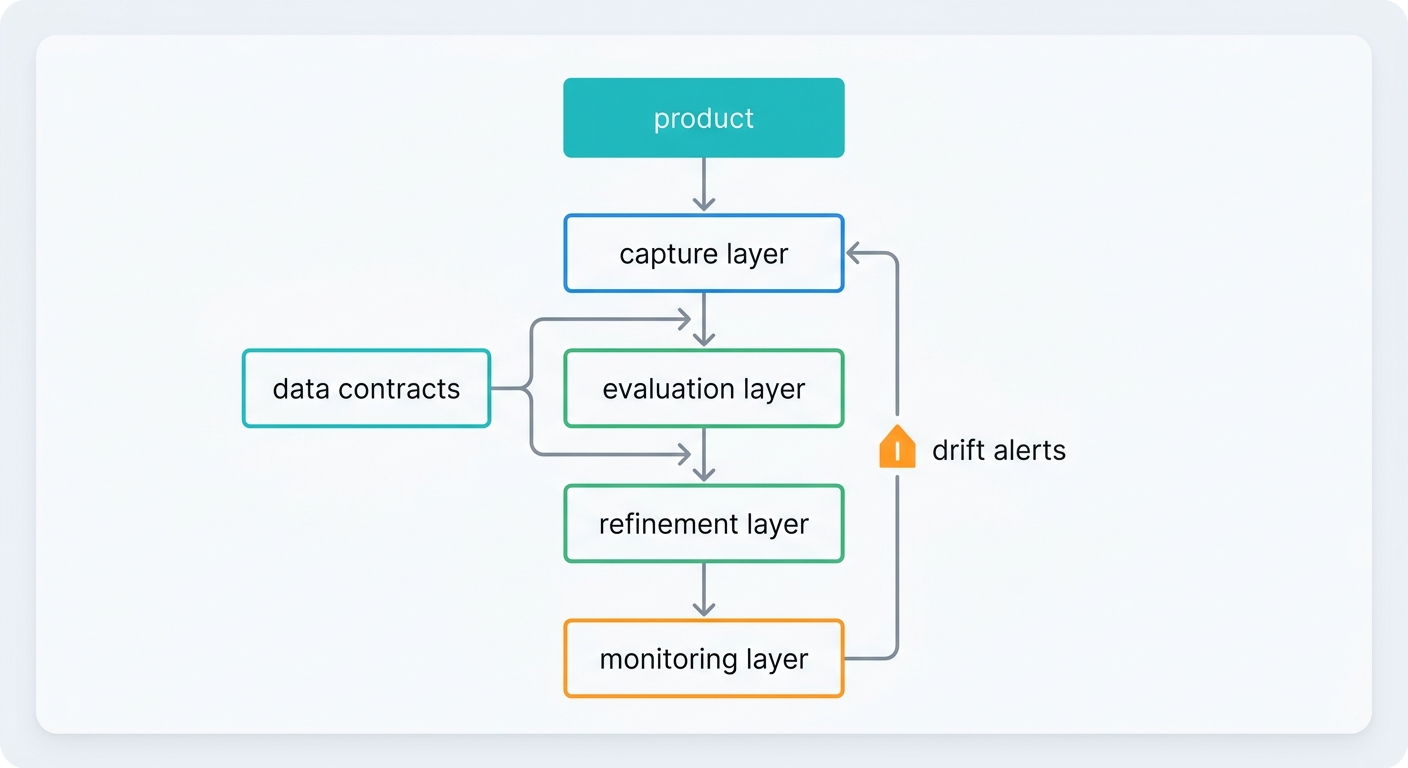
The pipeline has five components: the product, a capture layer, an eval layer, a refinement layer, and a monitoring layer.
The product serves users and generates responses. The capture layer logs prompts, outputs, and user actions. The eval layer scores everything against your suites. The refinement layer consumes high-value signals and improves the system. The monitoring layer watches health and raises alerts.
Define data contracts between stages. Each stage must hand the next one structured, versioned data. Sloppy hand-offs break the loop silently.
Monitoring catches drift before users complain. Watch quality metrics, latency, cost, and action rates over time. Alert when trends shift. A dashboard is not monitoring unless it triggers action.
Give the system an owner. Someone must maintain the eval suite, own the rubric, and approve refinements. Without an owner, the flywheel stalls into a backlog.
Common Mistakes That Kill the Loop
Most flywheel initiatives fail for predictable reasons. Learn these to avoid them.
Collecting without curating. Raw feedback is noisy. Two thumbs-downs mean very different things. Curate, deduplicate, and label before refining. Garbage in, garbage out applies to flywheels too.
Optimizing the wrong metric. If you reward the judge score and ignore outcomes, the model games the score. Tie refinement to real user value, not to a number.
Ignoring the owner problem. Nobody owns the eval suite, so nobody improves it. Assign clear responsibility or the loop dies.
Skipping eval gates. Deploying fine-tunes without regression checks invites silent breakage. Gates are not optional ceremony. They protect your users.
Over-engineering too early. A sprawling pipeline before you have signal is wasted effort. Start with three flows and grow. This keeps the loop honest.
Each of these mistakes is avoidable. They share one root cause: treating the flywheel as a tool instead of as a discipline.
A Practical Roadmap to Start This Month
You do not need a big team to start. The loop compounds, so small beginnings pay off.
Month 1 — Ship an eval suite. Pick three core flows. Label a golden set for each. Add eval gates to your deployment.
Month 2 — Add capture and dashboards. Log implicit signals. Build a simple dashboard so the team sees quality trends.
Month 3 — Automate and refine. Deploy an LLM judge, calibrated against your golden set. Run your first fine-tune behind eval gates. Evaluate the result carefully.
Start narrow. Add flows as you build confidence. The flywheel rewards consistency, not scale.
Conclusion
Static LLM products decay. Evaluation-driven data flywheels reverse that decay. They turn every interaction into durable improvement.
The formula is simple: generate, capture, evaluate, refine. Evaluation is the drive wheel. Build it first, and build it honestly.
Start with one eval suite this month. Then capture, then refine. The gains compound.
If you build LLM products in production, this is the operating model you need. Subscribe to our portal newsletter for deeper dives into evals, agents, and production LLM engineering. We share what actually works in the field.
Expert Q&A
Q: How many golden-set examples do I need before an eval suite is useful? A: Start small and stay honest. A few dozen high-quality, expert-labeled pairs per flow are enough to catch most regressions. Quality matters more than quantity. Ten carefully labeled examples beat a thousand noisy ones. Grow the set as you find real failures in production.
Q: My LLM judge agrees with humans 85 percent of the time. Is that good enough to replace human review? A: Partly. Eighty-five percent is excellent for ranking most outputs at scale. It is not enough for risky or ambiguous cases. Keep a human-in-the-loop tier for the hardest 5 to 10 percent of interactions. Use the judge to triage, not to make final calls on edge cases.
Q: What is the most common reason a flywheel fails in practice? A: Trust in the eval signal. Teams build the capture stage first, then realize their scoring is biased, and the whole loop is suspect. Build and calibrate the eval layer first. If you cannot trust the measurement, nothing downstream is worth doing.
Q: We fine-tuned our model and accuracy improved, but users say it feels worse. What happened? A: Your regressions hid in the noise. The fine-tune fixed the measured class of errors and quietly broke unmeasured behaviors, like tone or format. Run a regression suite across all core flows and add a frontier suite to probe unmeasured dimensions. If test accuracy rose but experience fell, your eval suite was too narrow.
Q: How do I detect reward hacking before it reaches production? A: Diversify your reward signal and audit the outputs. Do not optimize against a single metric. Sample polished-looking outputs and review them for hollow or misleading content. Compare judge scores with real outcome data, like task completion rates. Divergence between the two is the first warning sign.